Fig. 4
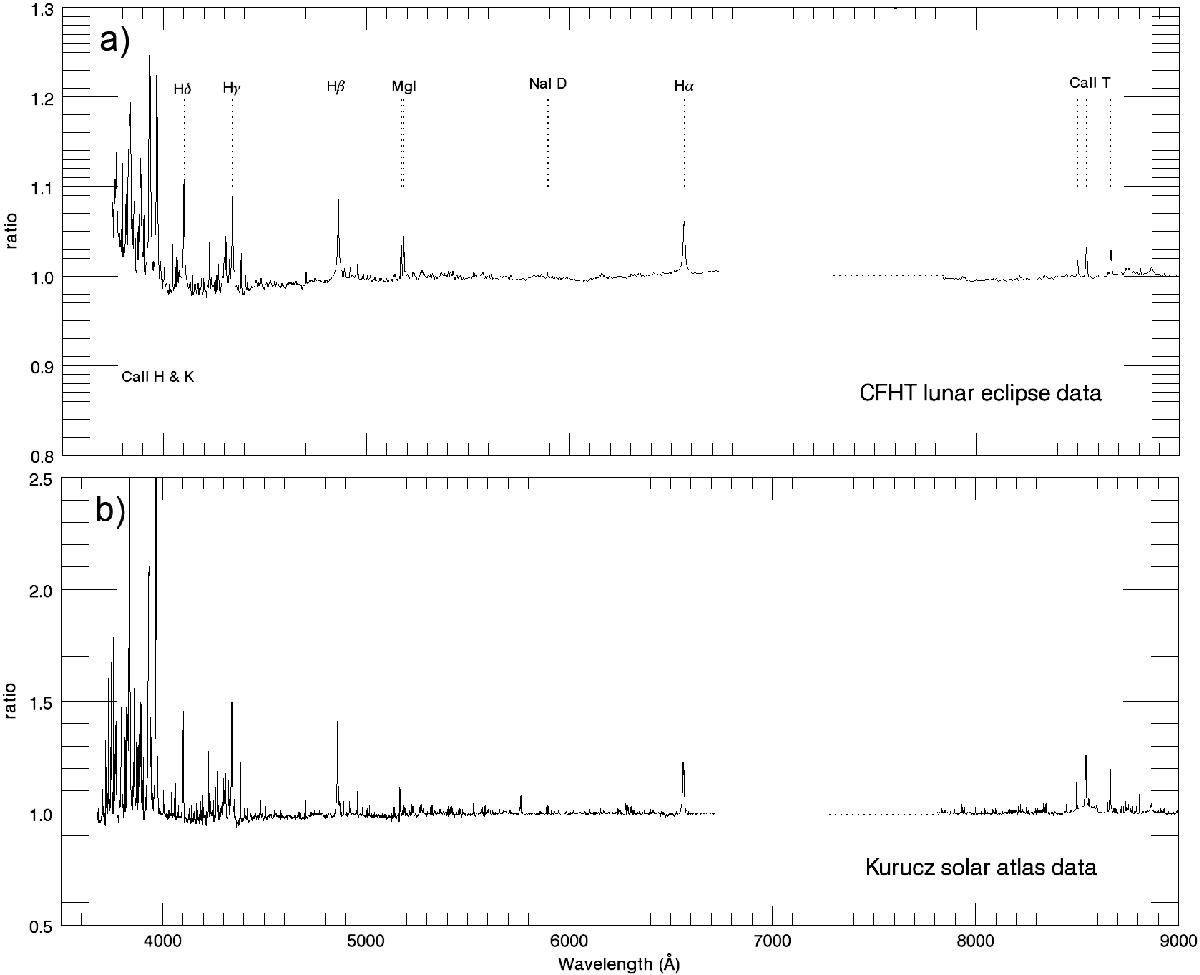
a) Ratio of a penumbral spectrum to a bright Moon spectrum observed on April 15 2014 by CFHT. The solar lines features remain in the ratio spectrum. The data is binned to a low resolution and the RV difference between the two spectra has been corrected. The dashed line region is where the telluric H2O and O2 lines are prominent. They are not shown here as we concentrate on the solar spectral feature. b) Ratio of the limb solar spectrum to the centre solar spectrum. The data are from the Kitt Peak Solar Atlas and binned to a low resolution.
Current usage metrics show cumulative count of Article Views (full-text article views including HTML views, PDF and ePub downloads, according to the available data) and Abstracts Views on Vision4Press platform.
Data correspond to usage on the plateform after 2015. The current usage metrics is available 48-96 hours after online publication and is updated daily on week days.
Initial download of the metrics may take a while.