Fig. 3
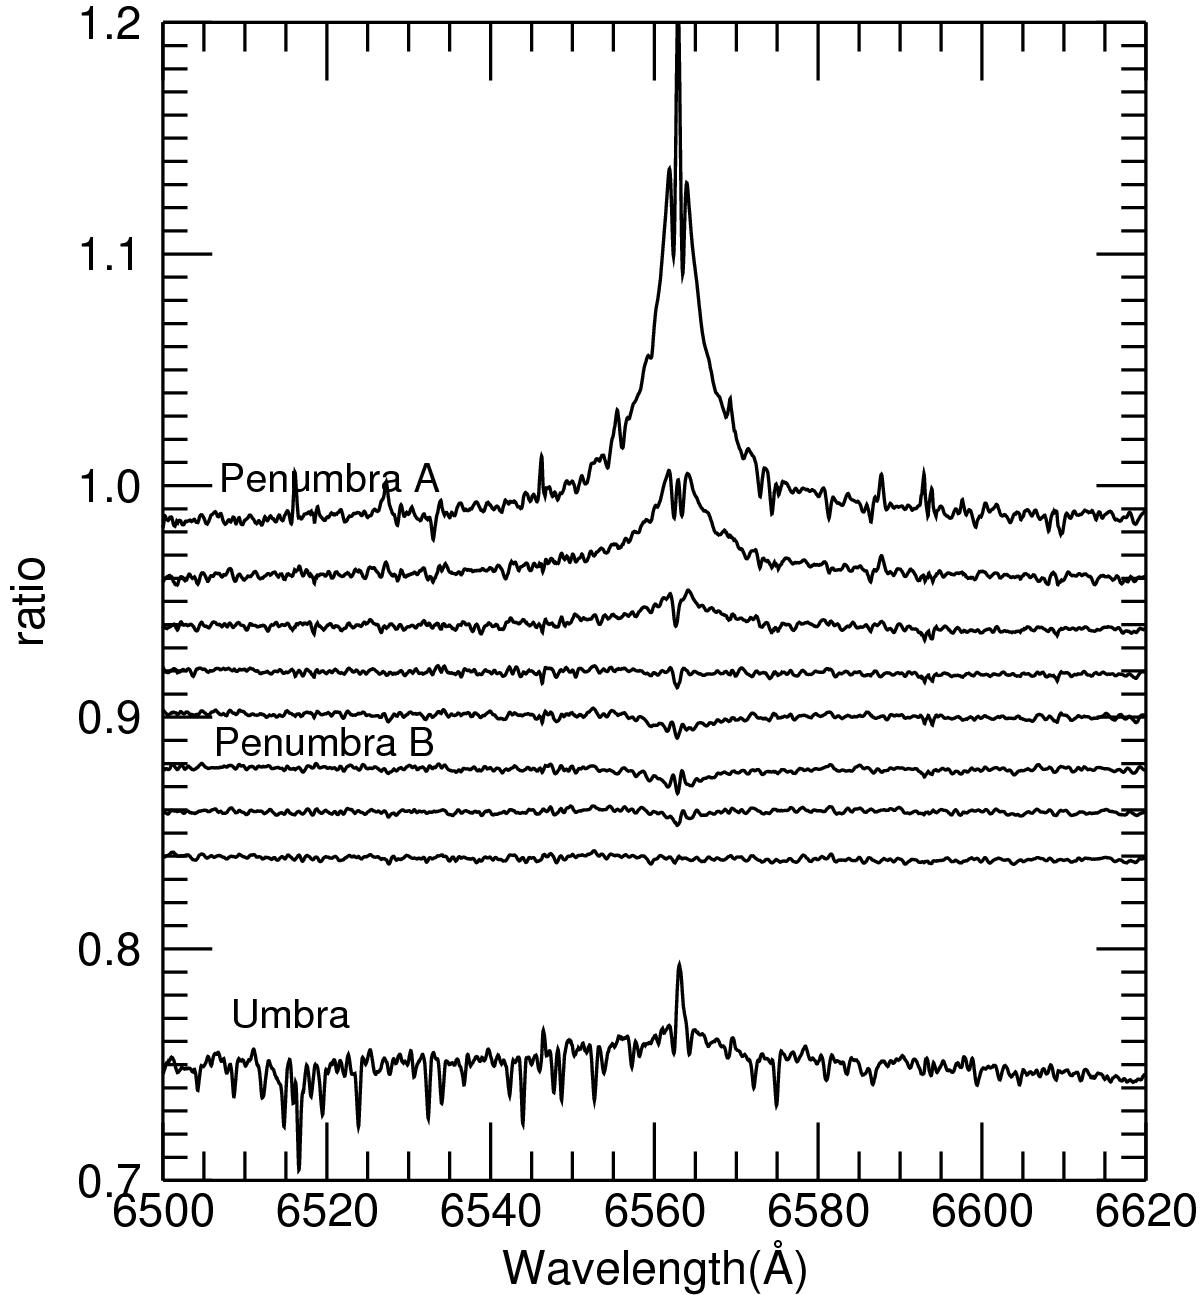
Change of Hα line shape in different penumbra spectra. The spectra are the ratios of the normalised penumbral to bright Moon spectra. The ratios are shifted sequentially by 0.02 for clarity. Eight penumbral spectra which were taken every ten minutes are chosen to represent different penumbral locations. The upper spectrum corresponds to the penumbral position close to the umbra (Penumbra A in Fig. 2), while the lower spectrum corresponds to the position close to the bright Moon (Penumbra B in Fig. 2). The normalised ratio of the umbral to the bright Moon spectrum is also shown at the bottom of the figure for comparison. This umbral spectrum is the sum of seven individual exposures that were taken at positions close to the edge of the umbra (i.e. close to Penumbra A). The total observed time for this umbral spectrum is about 20 min. The umbral spectrum has a relatively low signal-to-noise ratio and strong telluric absorption lines. The radial velocity differences between these spectra have been corrected.
Current usage metrics show cumulative count of Article Views (full-text article views including HTML views, PDF and ePub downloads, according to the available data) and Abstracts Views on Vision4Press platform.
Data correspond to usage on the plateform after 2015. The current usage metrics is available 48-96 hours after online publication and is updated daily on week days.
Initial download of the metrics may take a while.