Fig. 2
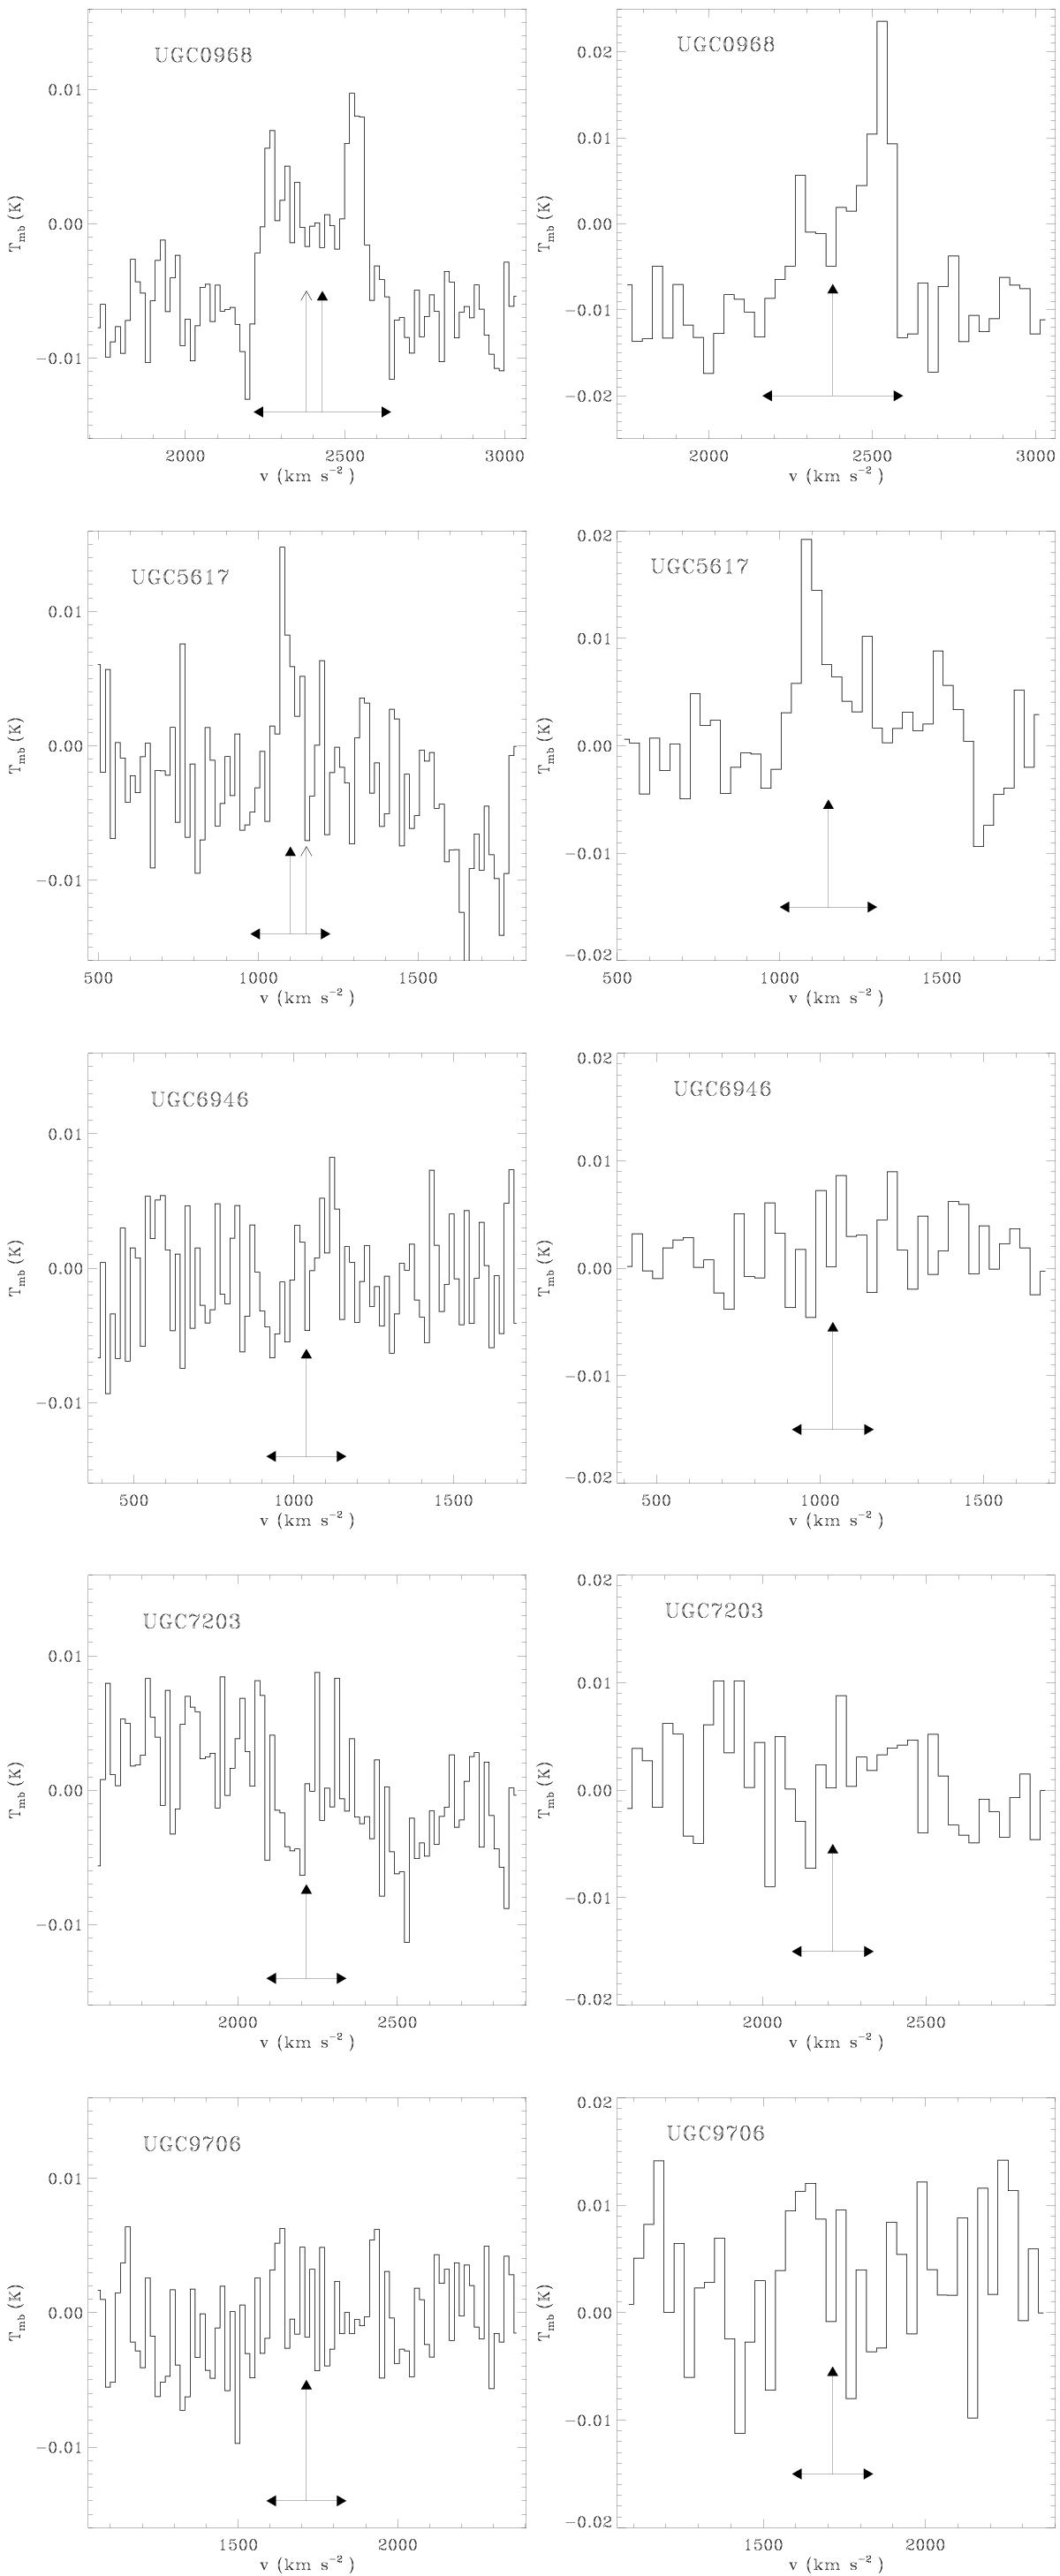
CO(1–0) (left) and CO(2–1) (right) spectra of the objects observed with the IRAM 30 m telescope. In each panel, the vertical arrow with filled head represents the central position of the line used to perform the Gaussian fit, while the other arrow marks the position expected by galaxy’s recession velocity. The horizontal arrows represent the velocity range on which the spectrum is integrated to derive the flux measurement.
Current usage metrics show cumulative count of Article Views (full-text article views including HTML views, PDF and ePub downloads, according to the available data) and Abstracts Views on Vision4Press platform.
Data correspond to usage on the plateform after 2015. The current usage metrics is available 48-96 hours after online publication and is updated daily on week days.
Initial download of the metrics may take a while.