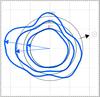
Fig. 2
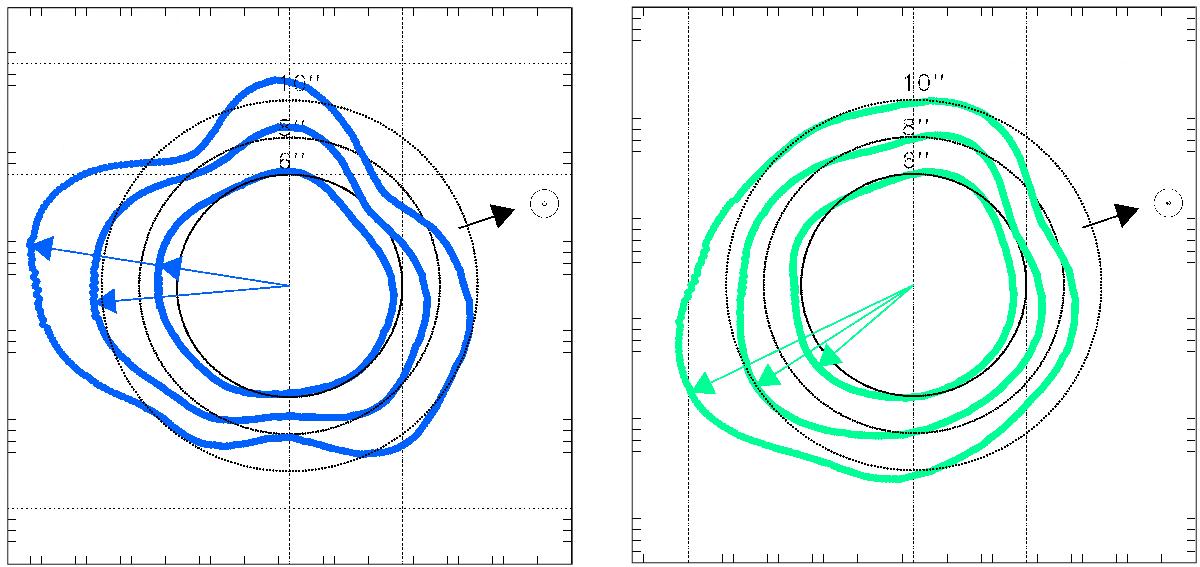
Dependence of integrated intensity on the position angle within 6′′, 8′′, and 10′′ of the intensity peak for the blue (left panel) and green (right panel) maps. The contours show the intensity integrated in 30° segments w.r.t. the average value. The circles correspond to the mean intensity at that specific radial distances, contours inside the circle indicate intensity below the average, while coutours outside the circle indicate an excess. The coloured arrows show the direction of the intensity maxima. The black arrow indicates the position angle of the Sun.
Current usage metrics show cumulative count of Article Views (full-text article views including HTML views, PDF and ePub downloads, according to the available data) and Abstracts Views on Vision4Press platform.
Data correspond to usage on the plateform after 2015. The current usage metrics is available 48-96 hours after online publication and is updated daily on week days.
Initial download of the metrics may take a while.