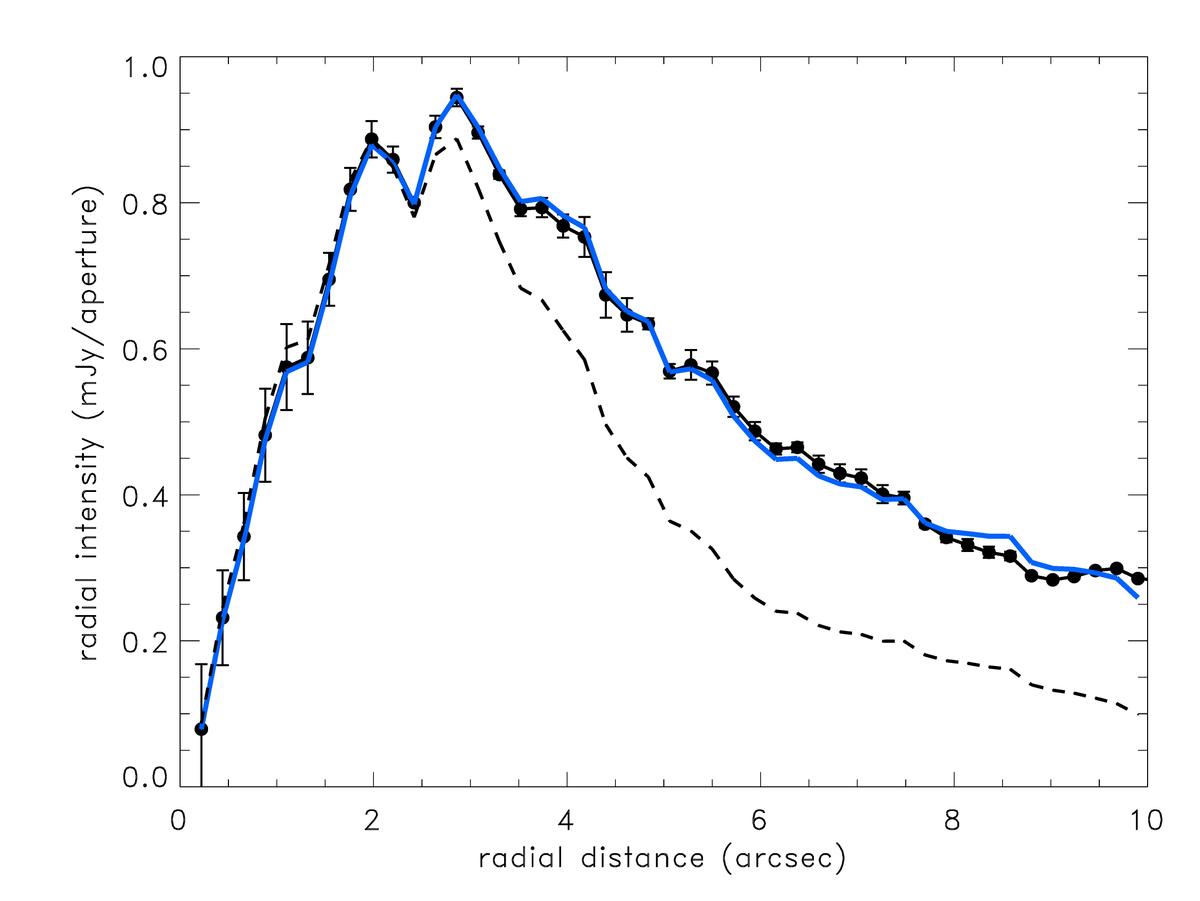
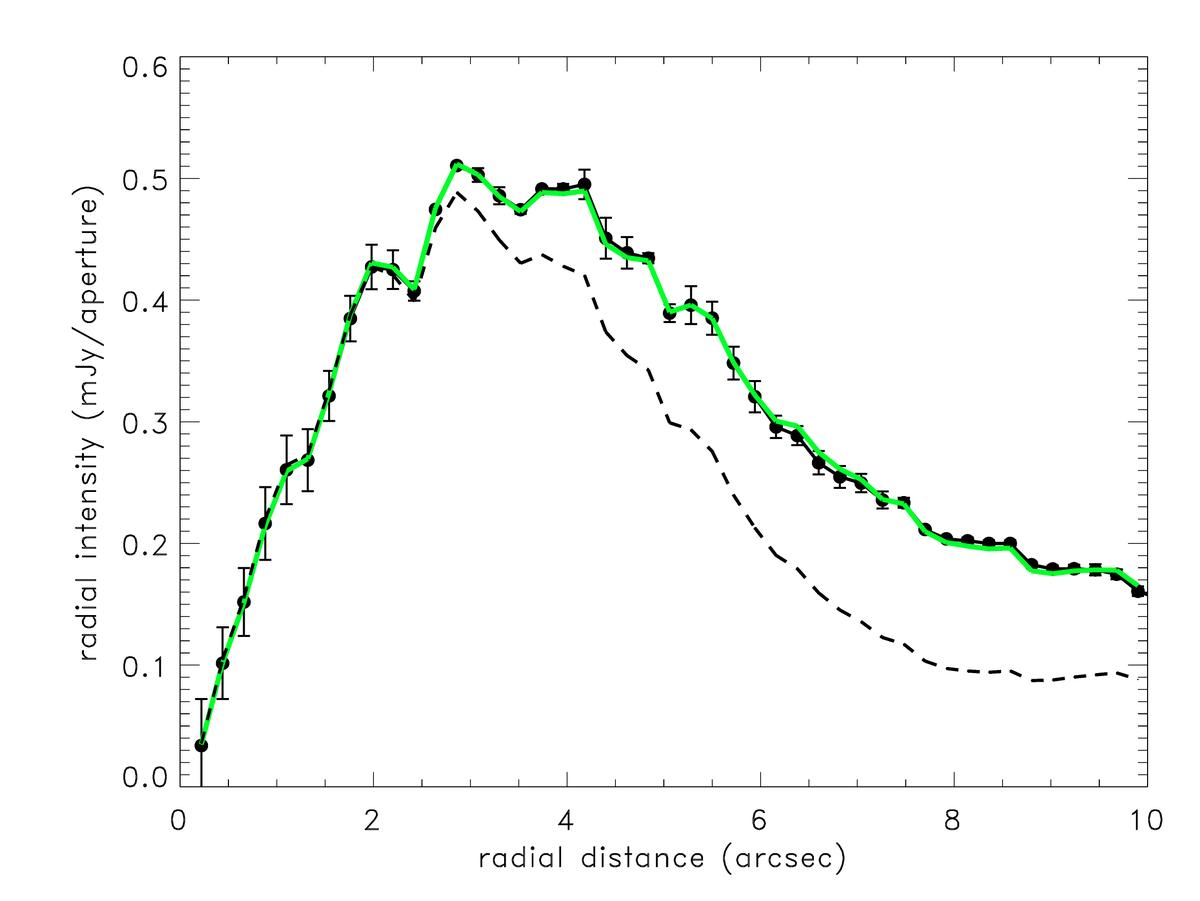
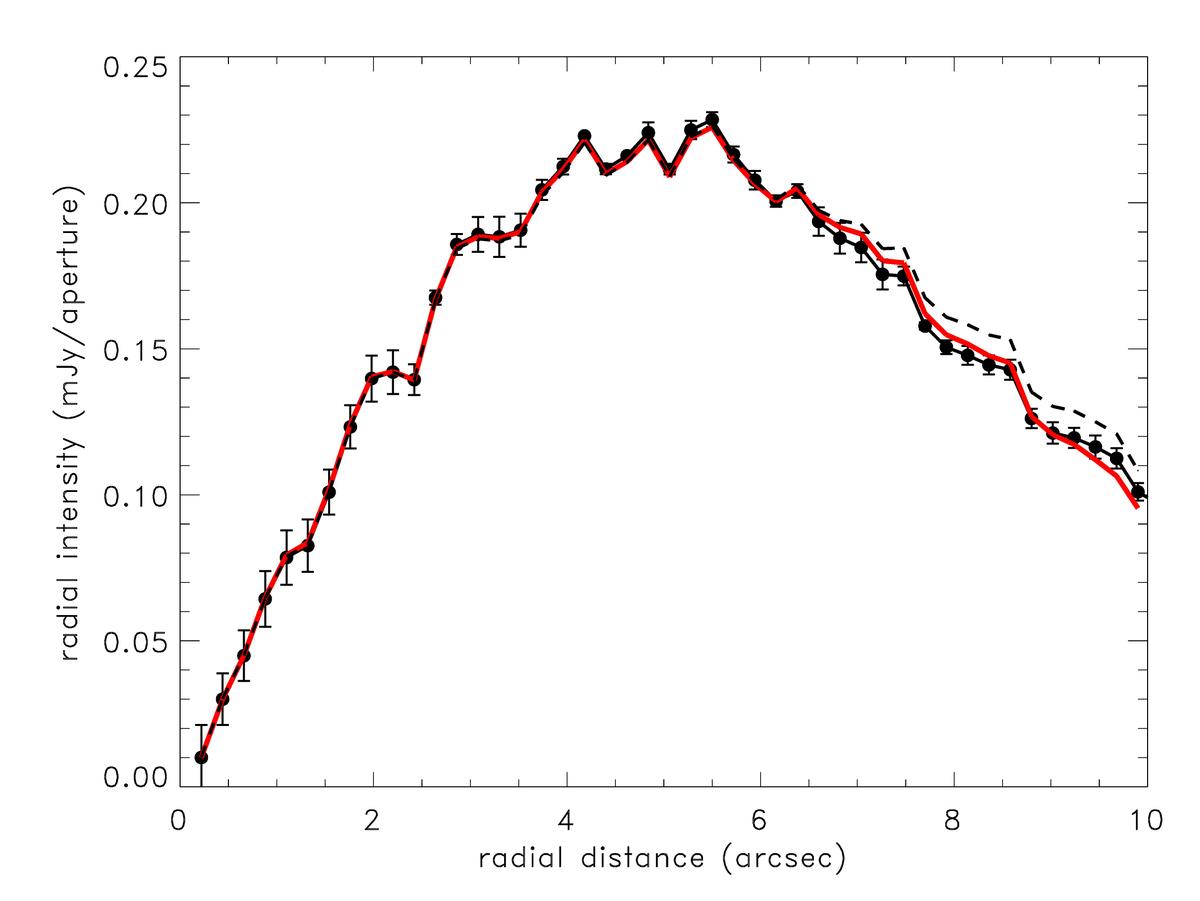
Fig. 1
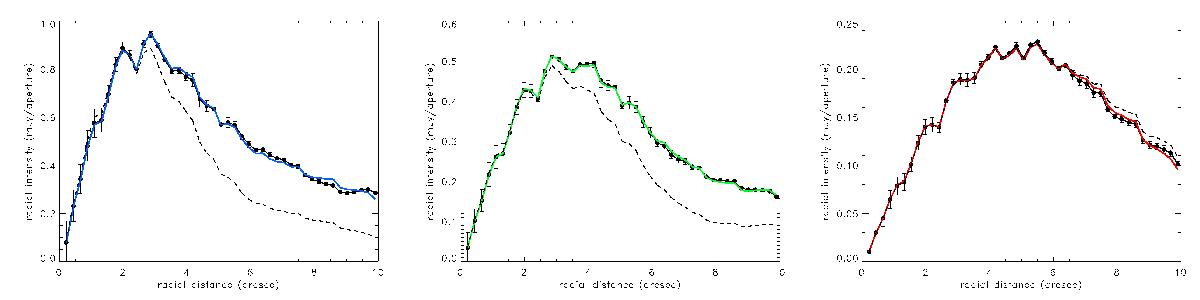
Radial intensity profiles in the three PACS band (70, 100, and 160 μm from left to right). The observed profiles are presented by black dots, while colour curves represent the best fit model profiles according to Eq. (1) (see Table 2). The corresponding radial intensity profiles of the respective PACS PSFs are shown as dashed curves.

Current usage metrics show cumulative count of Article Views (full-text article views including HTML views, PDF and ePub downloads, according to the available data) and Abstracts Views on Vision4Press platform.
Data correspond to usage on the plateform after 2015. The current usage metrics is available 48-96 hours after online publication and is updated daily on week days.
Initial download of the metrics may take a while.