Fig. 2
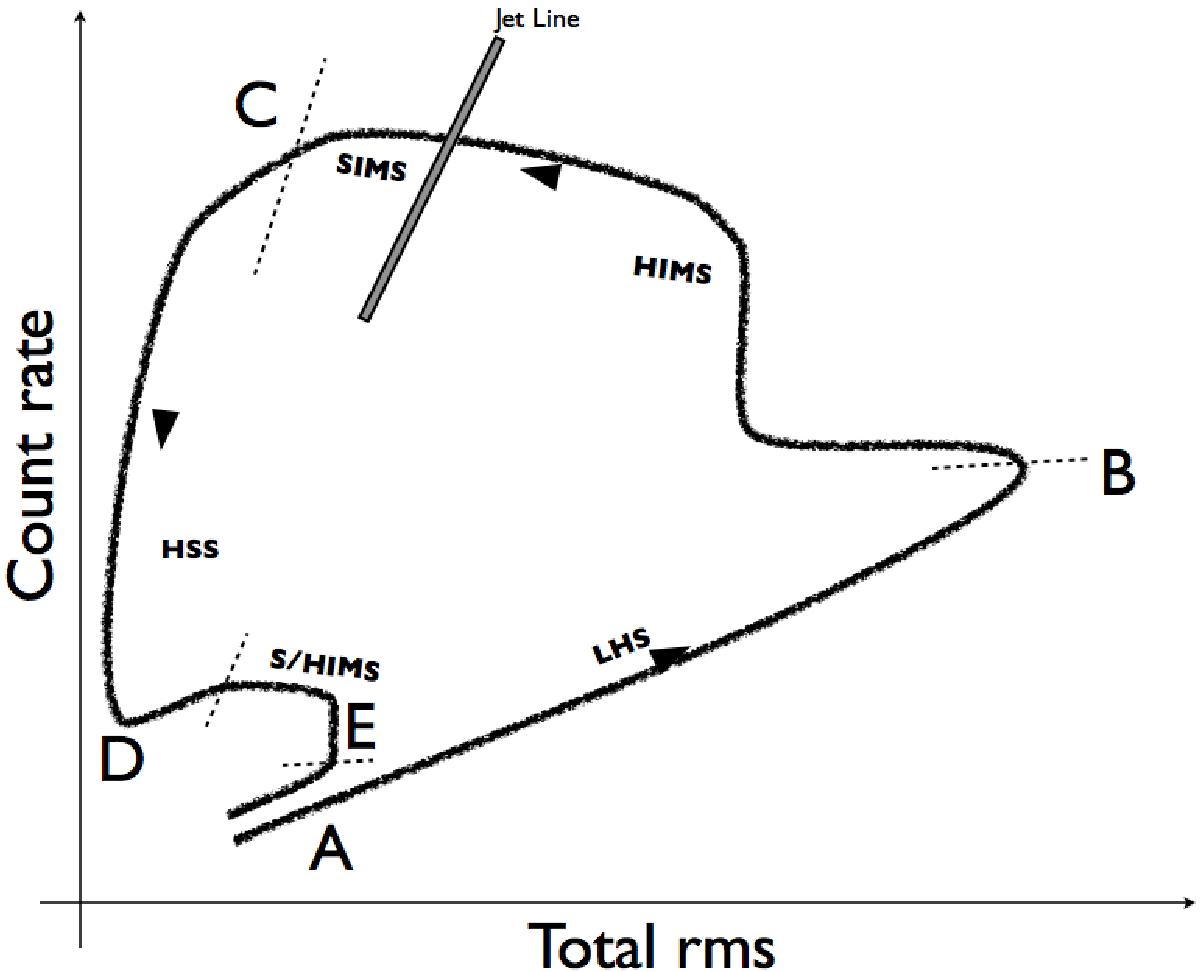
Schematic representation of the curve traversed by black-hole X-ray binaries in a RID. The dotted lines indicate the transition between states (marked with their acronyms). The arrows give the direction of motion along the line. The jet line is shown as a grey line. The points A, B, C, D, and E mark the same points as in Fig. 1.
Current usage metrics show cumulative count of Article Views (full-text article views including HTML views, PDF and ePub downloads, according to the available data) and Abstracts Views on Vision4Press platform.
Data correspond to usage on the plateform after 2015. The current usage metrics is available 48-96 hours after online publication and is updated daily on week days.
Initial download of the metrics may take a while.