Fig. 6
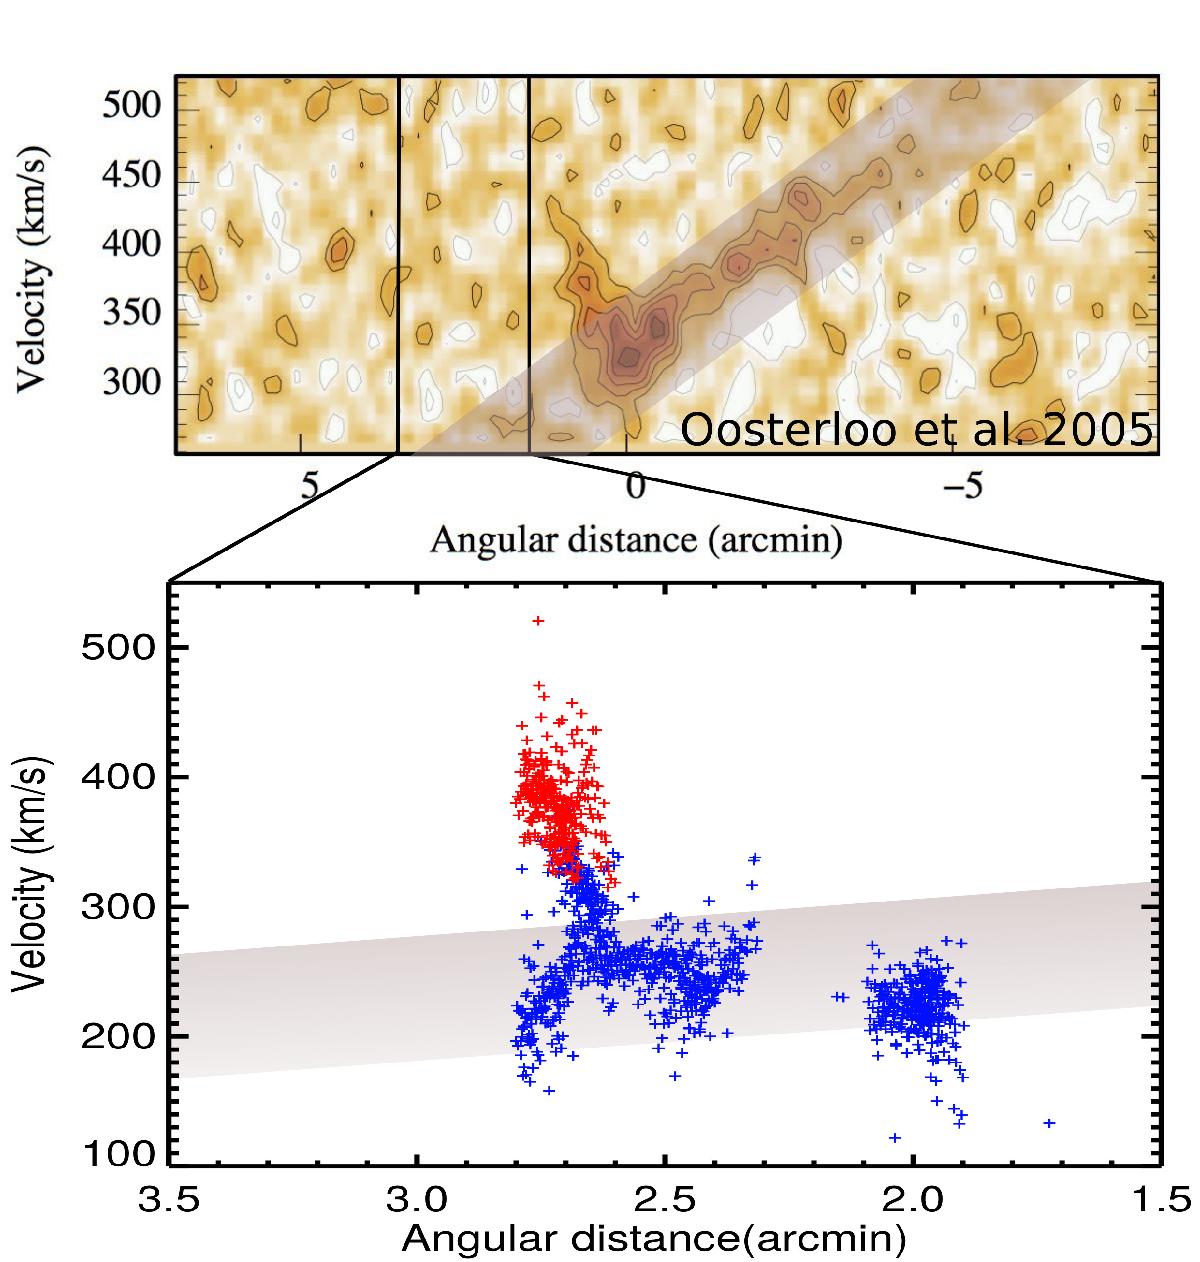
Position-velocity plot of the nearby H i cloud (upper panel) and of the ionized gas (lower panel). In the ionized gas position-velocity plot, the points related to the low and the high velocity components are drawn with blue and red crosses respectively. The shadowed stripe marks the large-scale velocity gradient of the H i cloud. In order to calculate the angular distance, the zero point along the horizontal axis is assumed to be located at RA = 13h26m15s and Dec = −42°49′00′′ in accordance with the position-velocity plot shown in the upper panel.
Current usage metrics show cumulative count of Article Views (full-text article views including HTML views, PDF and ePub downloads, according to the available data) and Abstracts Views on Vision4Press platform.
Data correspond to usage on the plateform after 2015. The current usage metrics is available 48-96 hours after online publication and is updated daily on week days.
Initial download of the metrics may take a while.