Free Access
Fig. 5
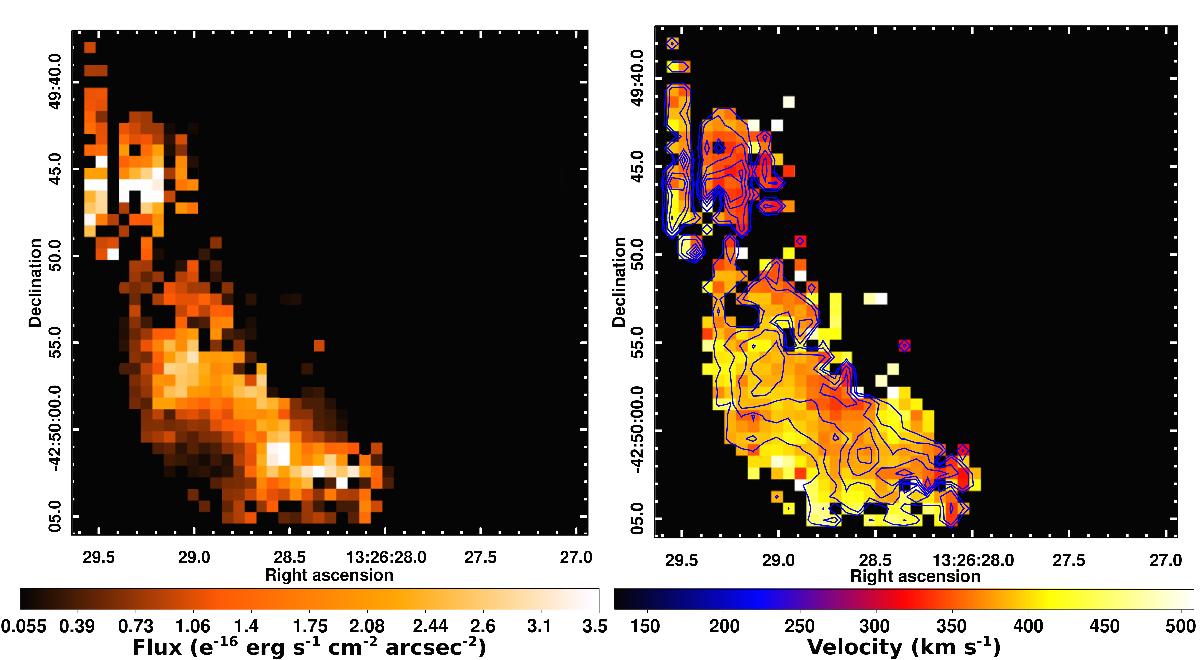
Total [O iii]λ5007 Å line flux (left panel) and velocity (right panel) map for the second ionized gas component that only extends across Field 2. Intensity contours are overplotted in blue on the velocity map. Contour levels are 0.4, 0.8, 1.6, 2.4, 3.1 × 10⁻¹⁶ erg s-1 cm-2 arcsec-2.
Current usage metrics show cumulative count of Article Views (full-text article views including HTML views, PDF and ePub downloads, according to the available data) and Abstracts Views on Vision4Press platform.
Data correspond to usage on the plateform after 2015. The current usage metrics is available 48-96 hours after online publication and is updated daily on week days.
Initial download of the metrics may take a while.