Fig. 2
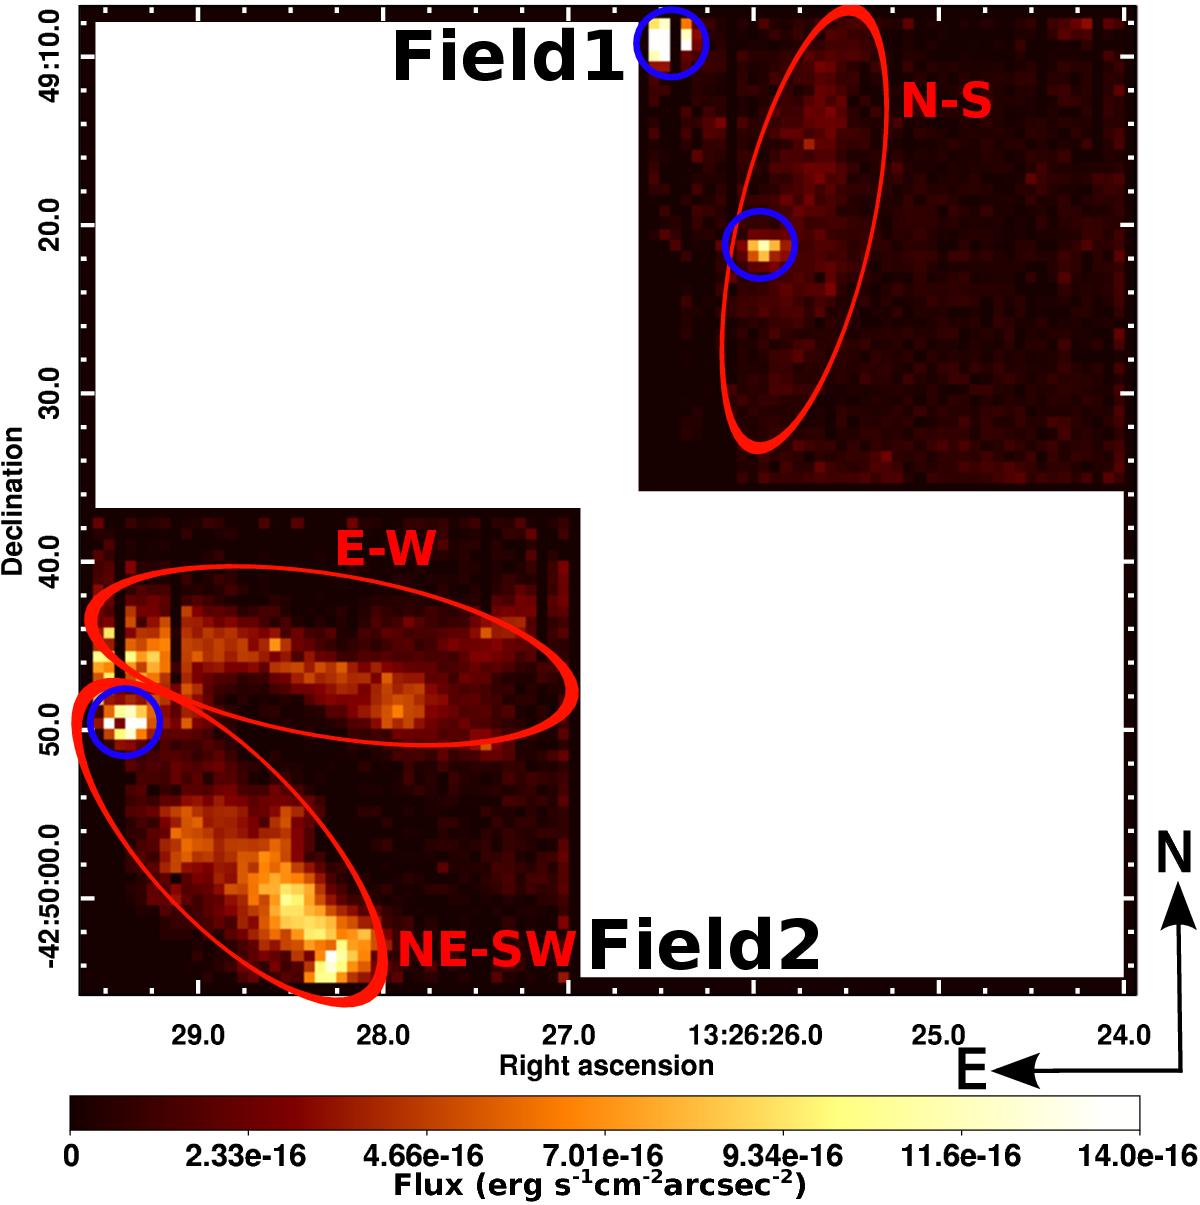
Total [O iii]λ5007 Å line flux map. Stronger ionized gas emission is visible in Field 2 while fainter emission is present in Field 1. Looking at the spatial distribution of the ionized gas, we locate three main filamentary structures that are outlined using red ellipses. Blue circles mark emission related to stars or associations of stars (see Rejkuba et al. 2002).
Current usage metrics show cumulative count of Article Views (full-text article views including HTML views, PDF and ePub downloads, according to the available data) and Abstracts Views on Vision4Press platform.
Data correspond to usage on the plateform after 2015. The current usage metrics is available 48-96 hours after online publication and is updated daily on week days.
Initial download of the metrics may take a while.