Fig. 1
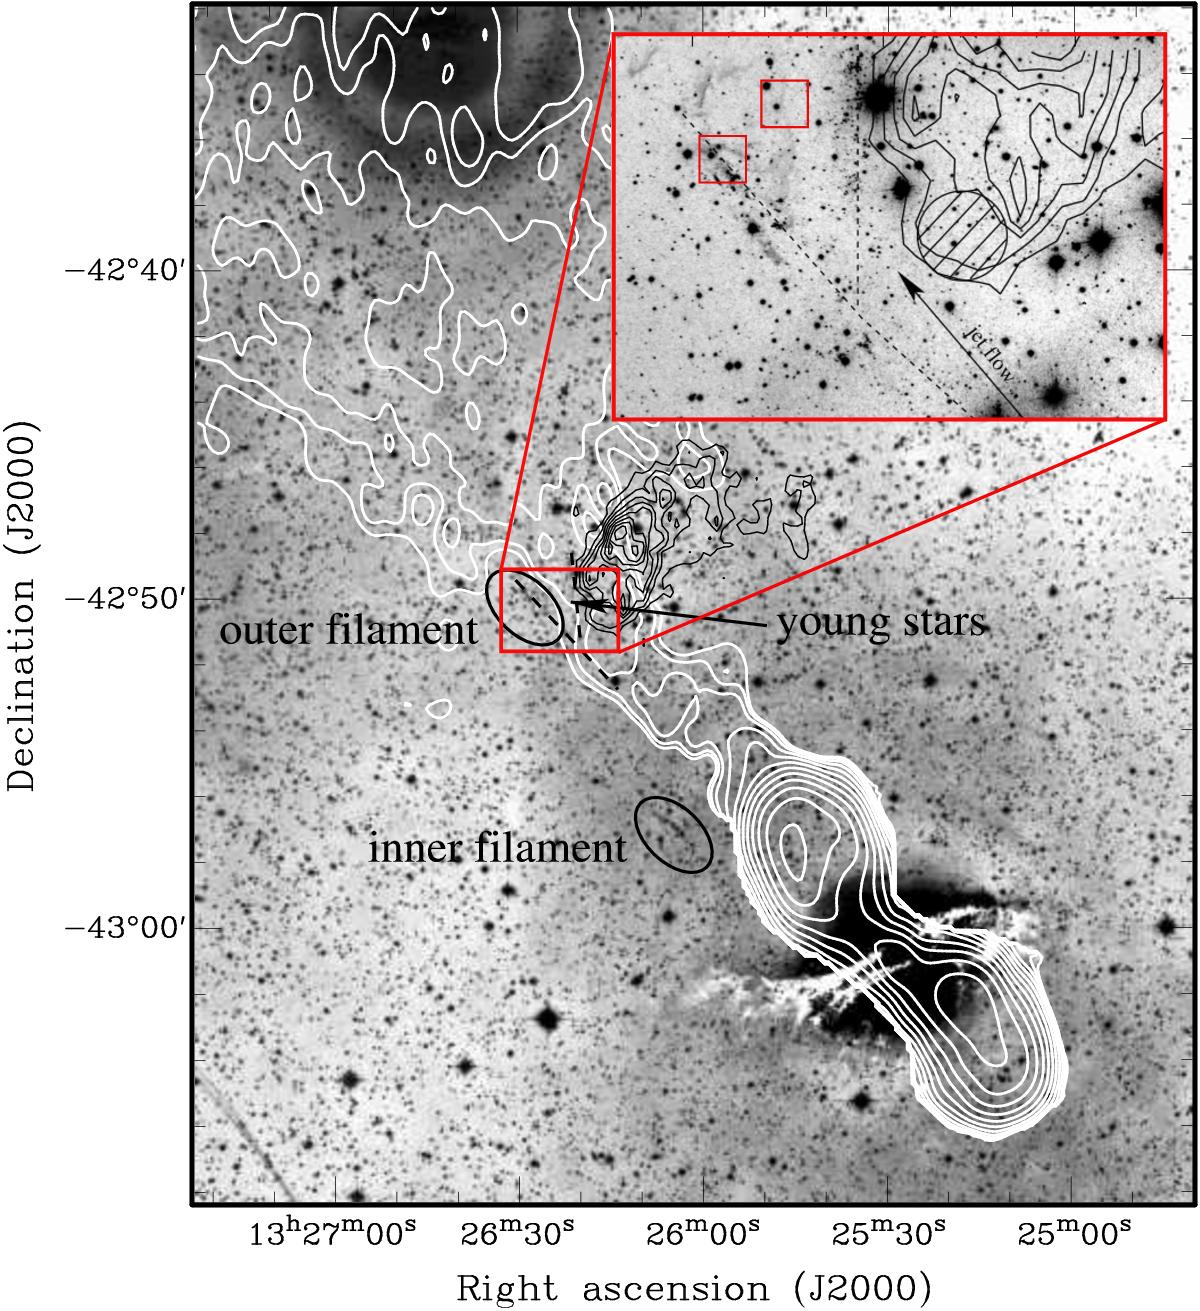
Optical image of Cen A (kindly provided by D. Malin) showing the diffuse emission and the location of the so-called inner and the outer filaments. The white contours denote the radio continuum emission of the inner lobes (bottom-right of the figure) and the large-scale jet connecting the northern inner lobe to the base of the outer lobe (top-left of the figure). The black contours refer to the northeast outer H i cloud. The location where young stars have been found is marked with a dashed line. Zoom in: optical image of the outer filament region (kindly provided by Rejkuba). The hatched area indicates where anomalous velocities are detected within the H i cloud. The region covered by our observations is drawn with two red squares.
Current usage metrics show cumulative count of Article Views (full-text article views including HTML views, PDF and ePub downloads, according to the available data) and Abstracts Views on Vision4Press platform.
Data correspond to usage on the plateform after 2015. The current usage metrics is available 48-96 hours after online publication and is updated daily on week days.
Initial download of the metrics may take a while.