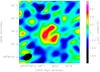
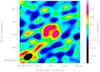
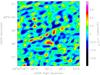
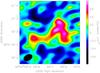
Fig. 7
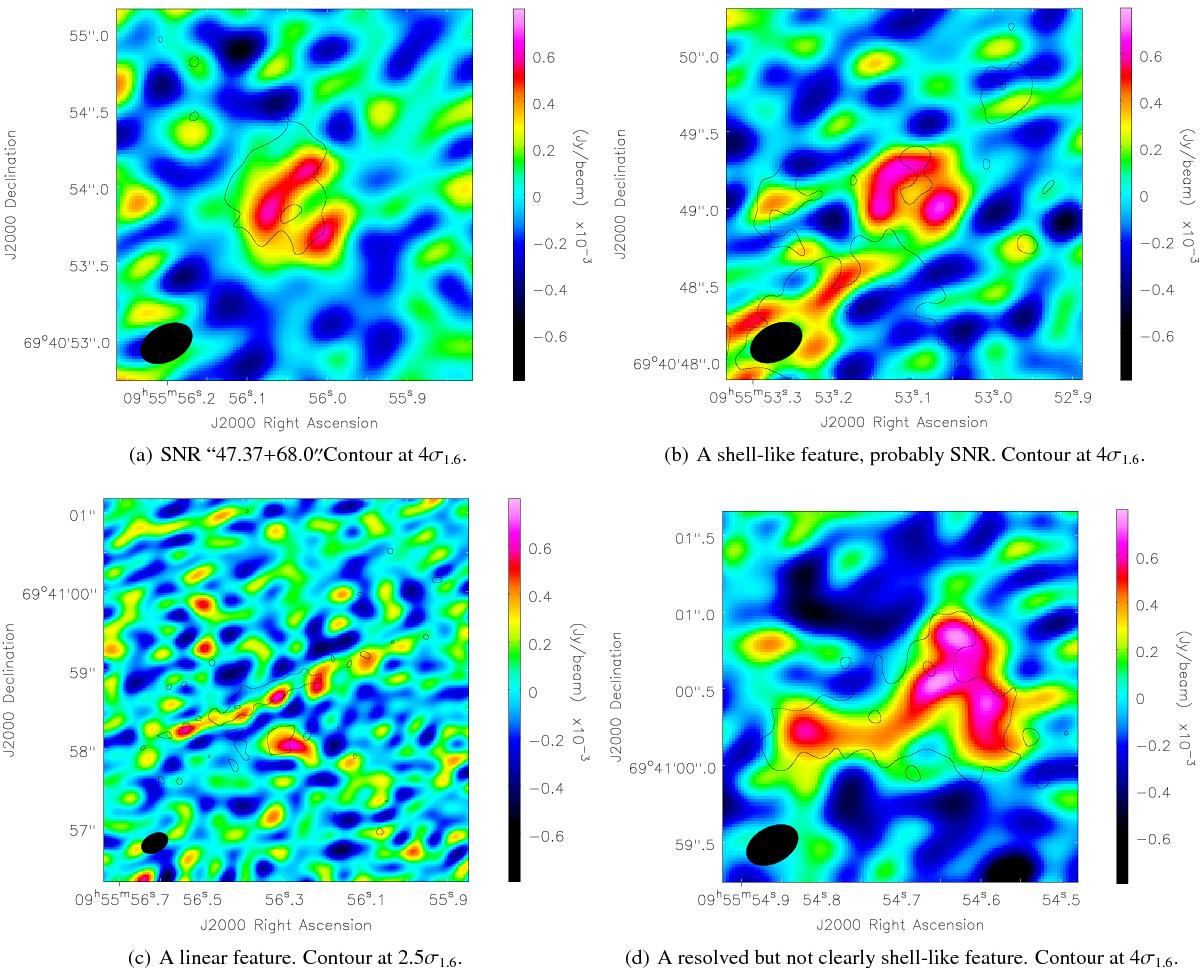
Zoom on four weak but resolved features seen in Fig. 2b. The LOFAR 154 MHz-beam is shown in the lower left corner. Each feature is briefly discussed in Sect. 4.6 where flux densities and positions are given. Colours are LOFAR 154 MHz, contours are eMERLIN at 1.6 GHz (σ1.6 = 16 μJy / beam, Pérez-Torres et al. 2014), see respective panel text for contour levels. The top panels show two shell-like structures; the top-left is identified as the SNR listed as “47.37+68.0” by Wills et al. (1997), while the top-right is uncatalogued. The bottom-left panel shows a linear feature and bottom-right shows a resolved but not clearly shell-like object. Note that the bottom-left panel covers a larger area on sky, and has lower contour levels, compared to the other three panels. We note a minor positional offset of approximately 60 mas between the LOFAR and eMERLIN images, see Sect. 4.1 for a brief discussion on positional accuracy.
Current usage metrics show cumulative count of Article Views (full-text article views including HTML views, PDF and ePub downloads, according to the available data) and Abstracts Views on Vision4Press platform.
Data correspond to usage on the plateform after 2015. The current usage metrics is available 48-96 hours after online publication and is updated daily on week days.
Initial download of the metrics may take a while.