Fig. 5
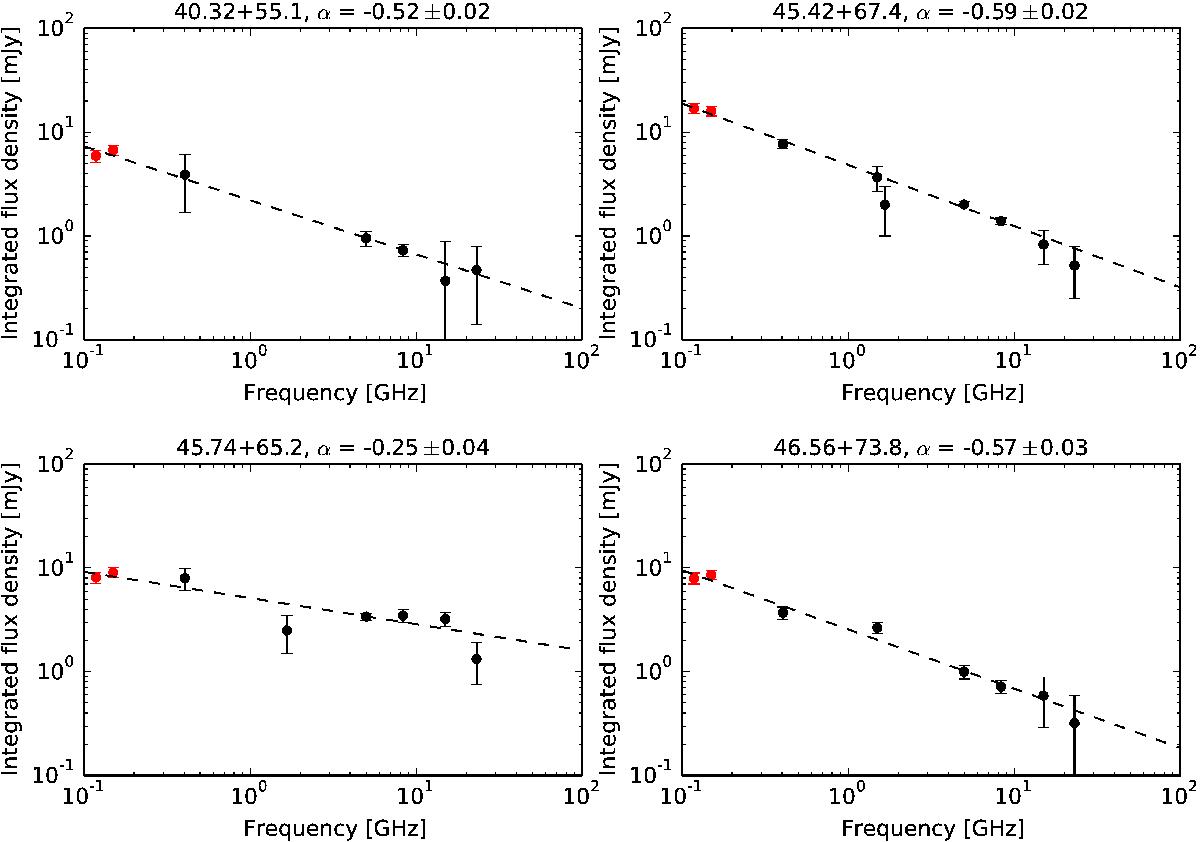
Spectra of four compact objects detected with LOFAR, and also reported at 408 MHz by Wills et al. (1997). These objects show no low-frequency turn-over at LOFAR frequencies. LOFAR data points are plotted in red. Non-LOFAR data points are VLA and MERLIN, as presented in Table 2 by Allen & Kronberg (1998). A simple power law (Sν ∝ να) was fitted and is plotted as a dashed line. The best fit α is given in the respective figure title.
Current usage metrics show cumulative count of Article Views (full-text article views including HTML views, PDF and ePub downloads, according to the available data) and Abstracts Views on Vision4Press platform.
Data correspond to usage on the plateform after 2015. The current usage metrics is available 48-96 hours after online publication and is updated daily on week days.
Initial download of the metrics may take a while.