Fig. 3
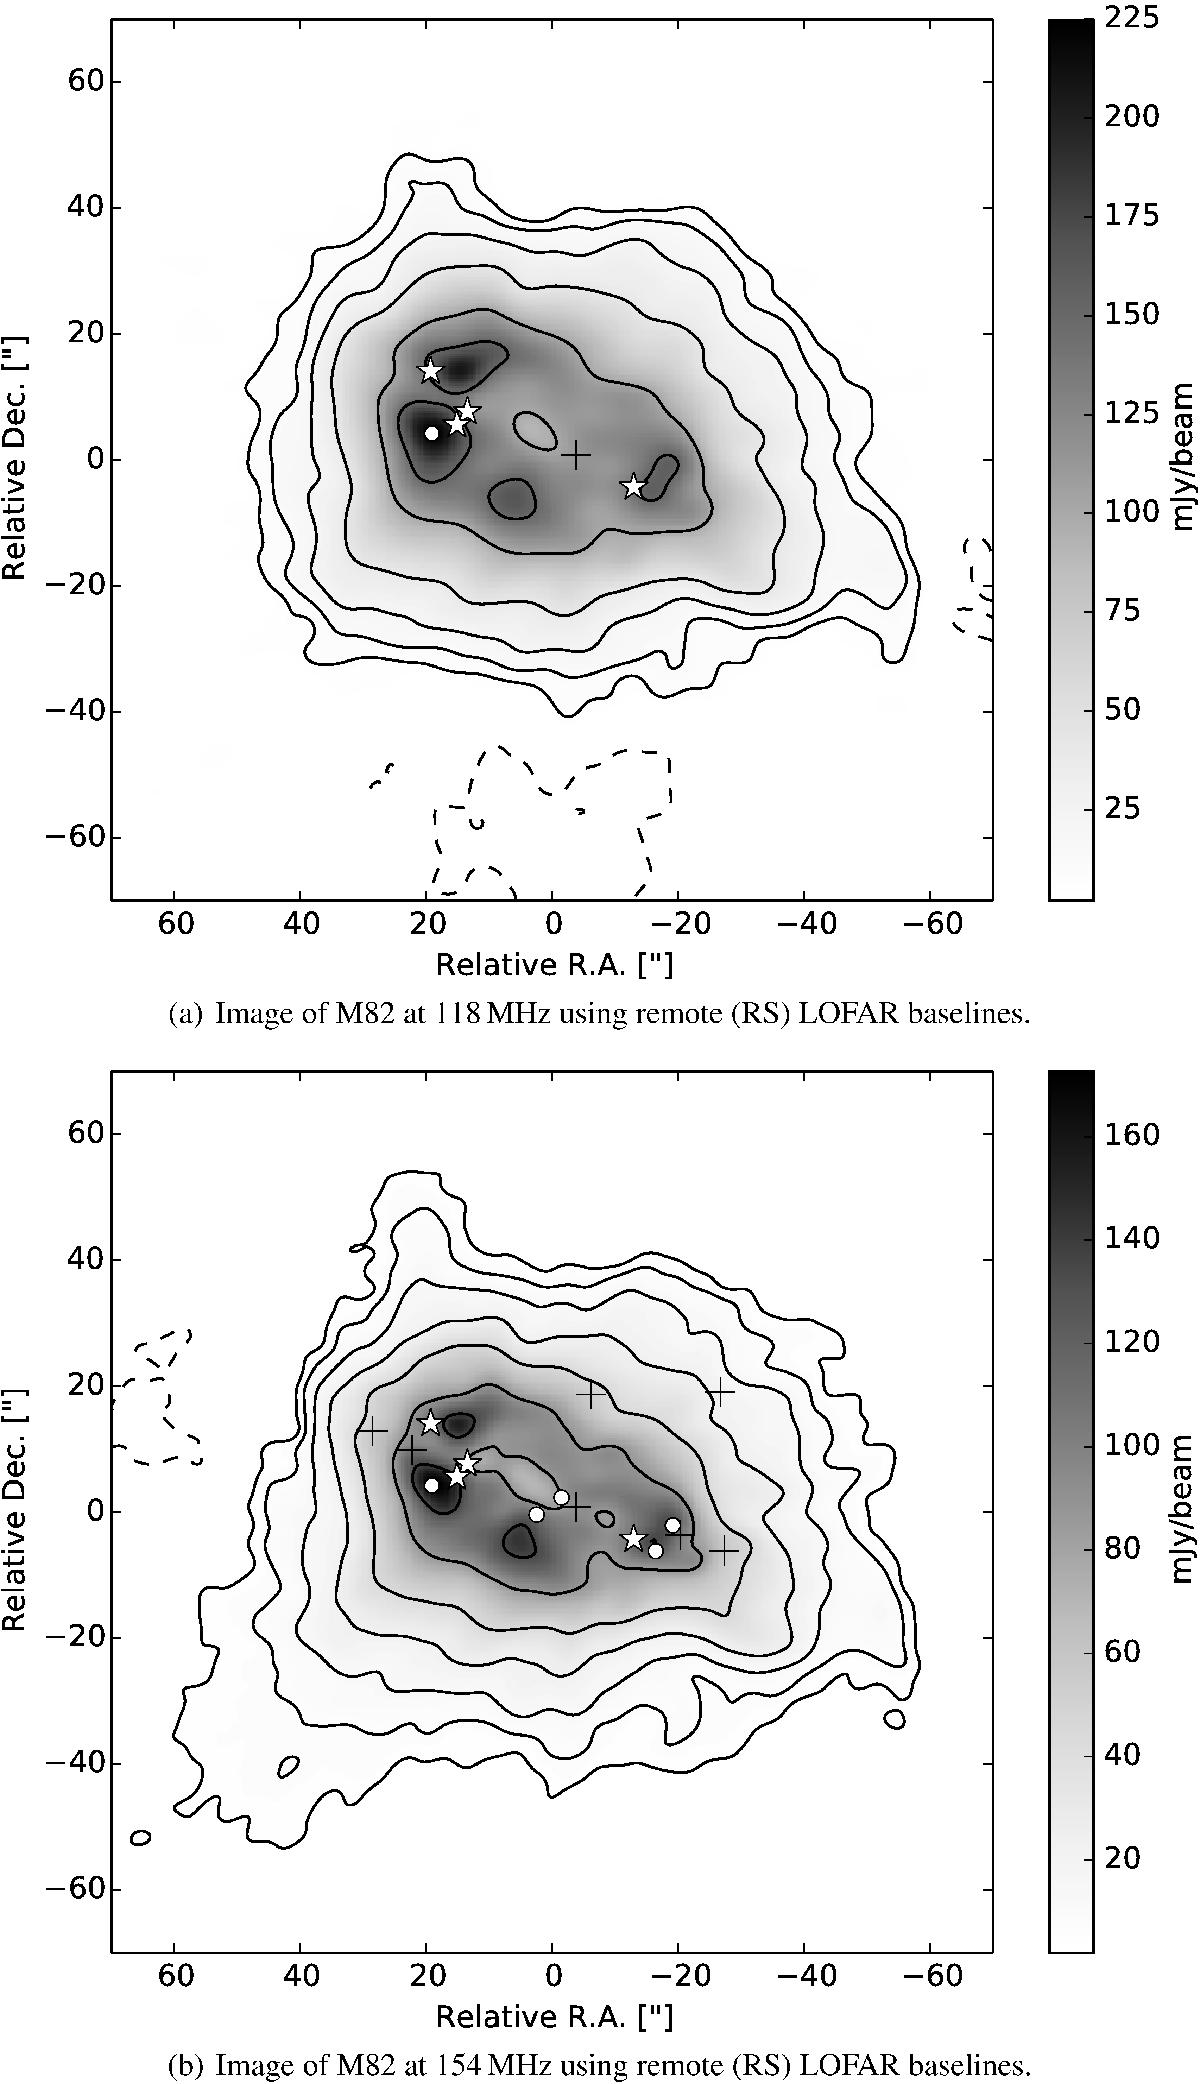
Images of M82 at 118 MHz (upper panel) and 154 MHz (lower panel) made using LOFAR baselines of length between 2 kλ and 60 kλ (robust 0 weighting). At 118 MHz the synthesised PSF (beam) is 5.79′′ × 4.53′′ and the rms noise is σ118 = 0.50 mJy / beam. At 154 MHz the PSF is 4.66′′ × 3.56′′ and the rms noise is σ154 = 0.27 mJy / beam. For deconvolution parameters, see Sect. 3.2. These images show the structure of the extended emission in grey scale (with brightness per respective beam size). The upper panel contours are drawn at (− 10,10,20,40,80,200,300) × σ118 and the lower panel contours are (− 10,10,20,40,80,160,320,500) × σ154. The symbols mark the positions of the sources listed in Table 2. The stars mark the power law-spectrum objects, shown in Fig. 5. The circles mark the turnover-spectrum objects, shown in Fig. 6. The plus signs mark the remaining objects listed in Table 2. Positions are given relative to the M82 position in Table 1.
Current usage metrics show cumulative count of Article Views (full-text article views including HTML views, PDF and ePub downloads, according to the available data) and Abstracts Views on Vision4Press platform.
Data correspond to usage on the plateform after 2015. The current usage metrics is available 48-96 hours after online publication and is updated daily on week days.
Initial download of the metrics may take a while.