Fig. 8
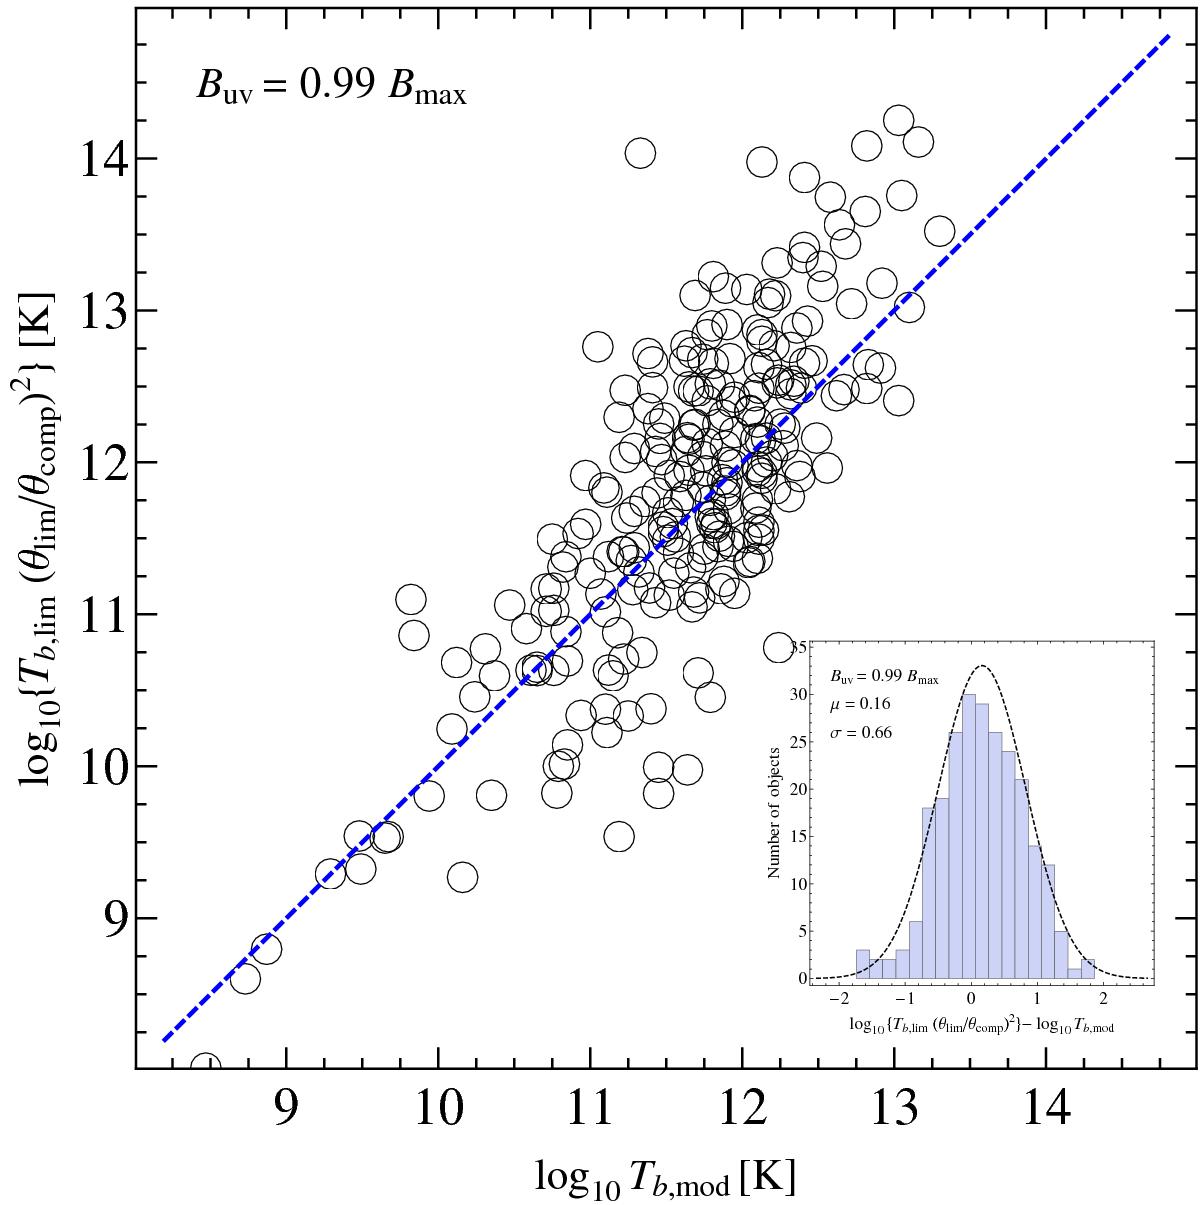
Correction of the distribution shown in Fig. 6 for the square of the resolution factor θlim/θcomp. The corrected Tb,lim distribution is statistically very close to the Tb,mod obtained from the model-fitting analysis. The values of Tb,lim are on average 40% higher than the respective values of Tb,mod. This is also demonstrated by the residual logarithmic distribution of the Tb,lim/Tb,mod ratio (inset), which can be approximated by the Gaussian PDF with μ = 0.16 and σ = 0.66.
Current usage metrics show cumulative count of Article Views (full-text article views including HTML views, PDF and ePub downloads, according to the available data) and Abstracts Views on Vision4Press platform.
Data correspond to usage on the plateform after 2015. The current usage metrics is available 48-96 hours after online publication and is updated daily on week days.
Initial download of the metrics may take a while.