Fig. 6
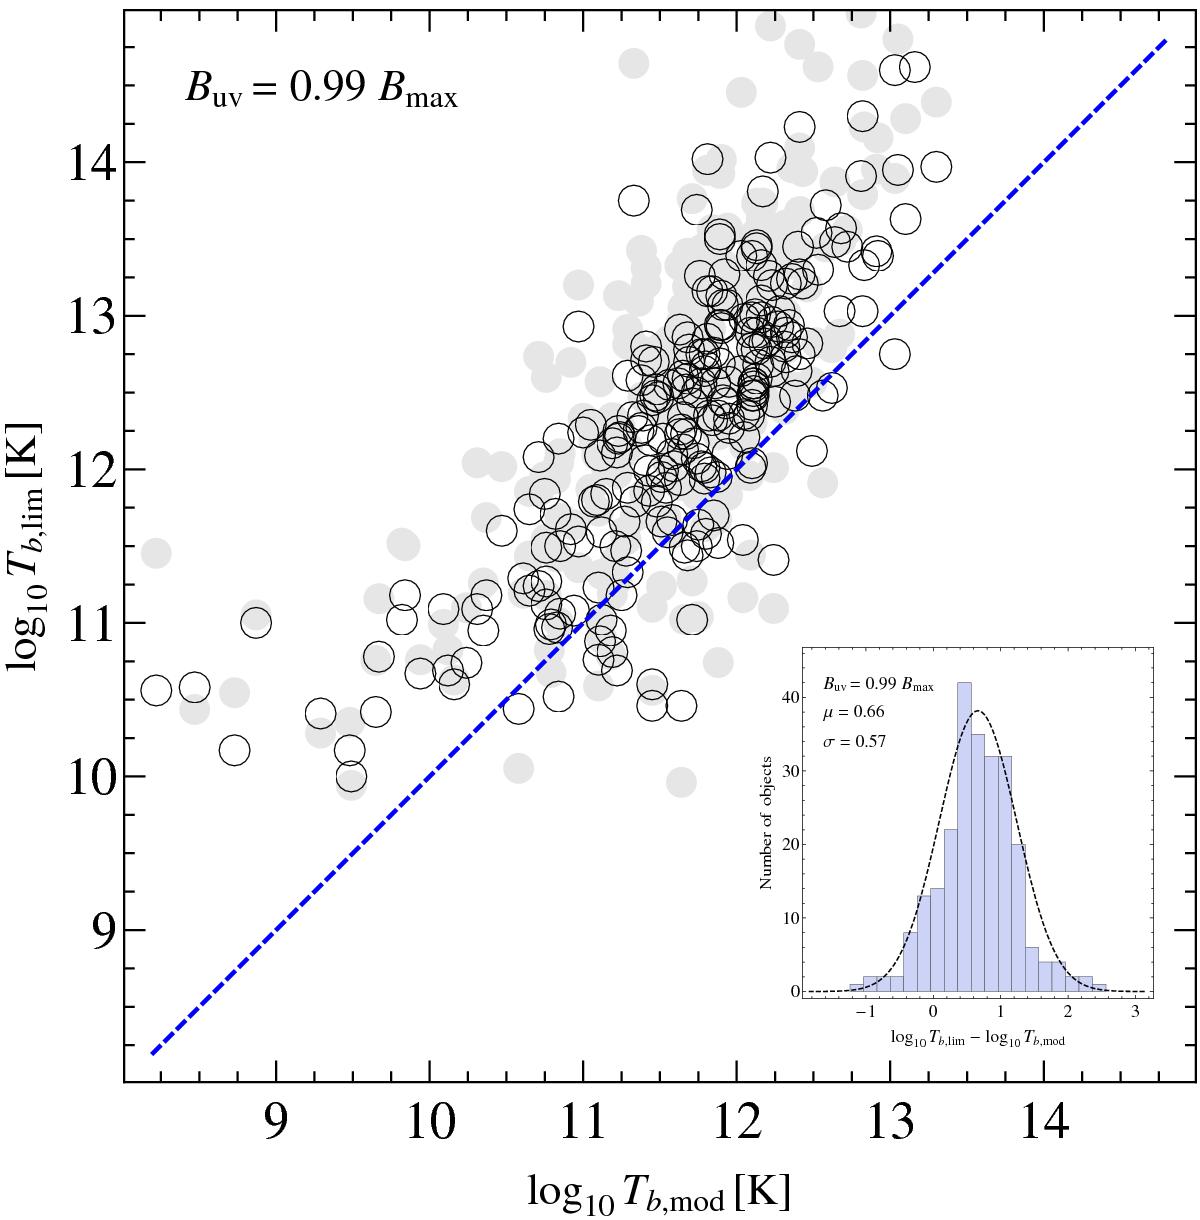
Comparison of Tb,lim (circular Gaussian approximation) and Tb,mod estimates obtained from the MOJAVE data (open circles). Gray circles illustrate the effect of correcting Tb,lim for the putative elongation of the core region. The dashed line marks the one-to-one correspondence between the two estimates. For each object, the Tb,lim is estimated from MOJAVE data at Ruv ≥ 0.99 Bmax to restrict the visibility information to the most compact structures. The resulting Tb,lim are on average 4.6 times higher than Tb,mod. The residual logarithmic distribution of the Tb,lim/Tb,mod ratio (inset) can be approximated by the Gaussian PDF with μ = 0.66 and σ = 0.57. At Tb,mod ≲ 1010 K the Tb,lim may be biased by large-scale structure contributions in strongly jet-dominated objects.
Current usage metrics show cumulative count of Article Views (full-text article views including HTML views, PDF and ePub downloads, according to the available data) and Abstracts Views on Vision4Press platform.
Data correspond to usage on the plateform after 2015. The current usage metrics is available 48-96 hours after online publication and is updated daily on week days.
Initial download of the metrics may take a while.