Fig. 4
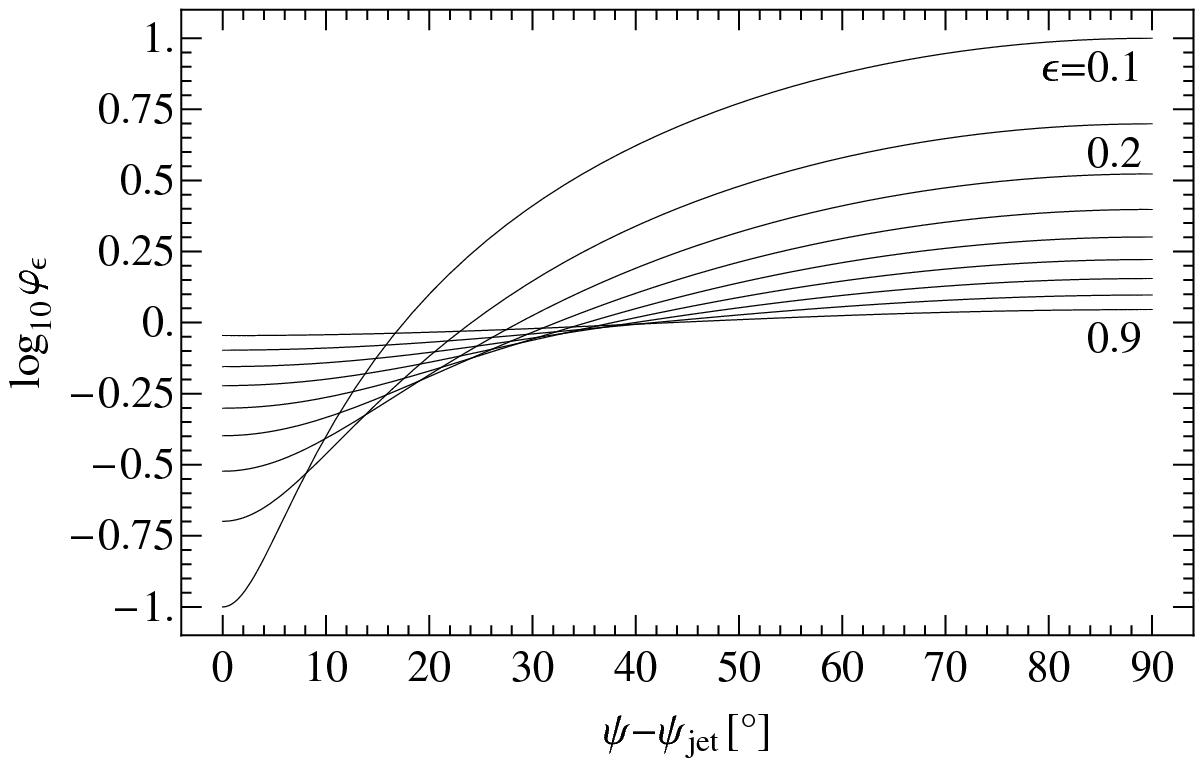
Brightness temperature correction to account for the elongation of the emitting region. The elongated region is described by an elliptical Gaussian with an axial ratio ϵ. The corrections are plotted against the difference between the position angle of a visibility measurement and the position angle of the major axis of the Gaussian. Different curves correspond to the corrections for values of ϵ taken in steps of 0.1 between ϵ = 0.1 and ϵ = 0.9.
Current usage metrics show cumulative count of Article Views (full-text article views including HTML views, PDF and ePub downloads, according to the available data) and Abstracts Views on Vision4Press platform.
Data correspond to usage on the plateform after 2015. The current usage metrics is available 48-96 hours after online publication and is updated daily on week days.
Initial download of the metrics may take a while.