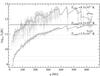
Fig. 3
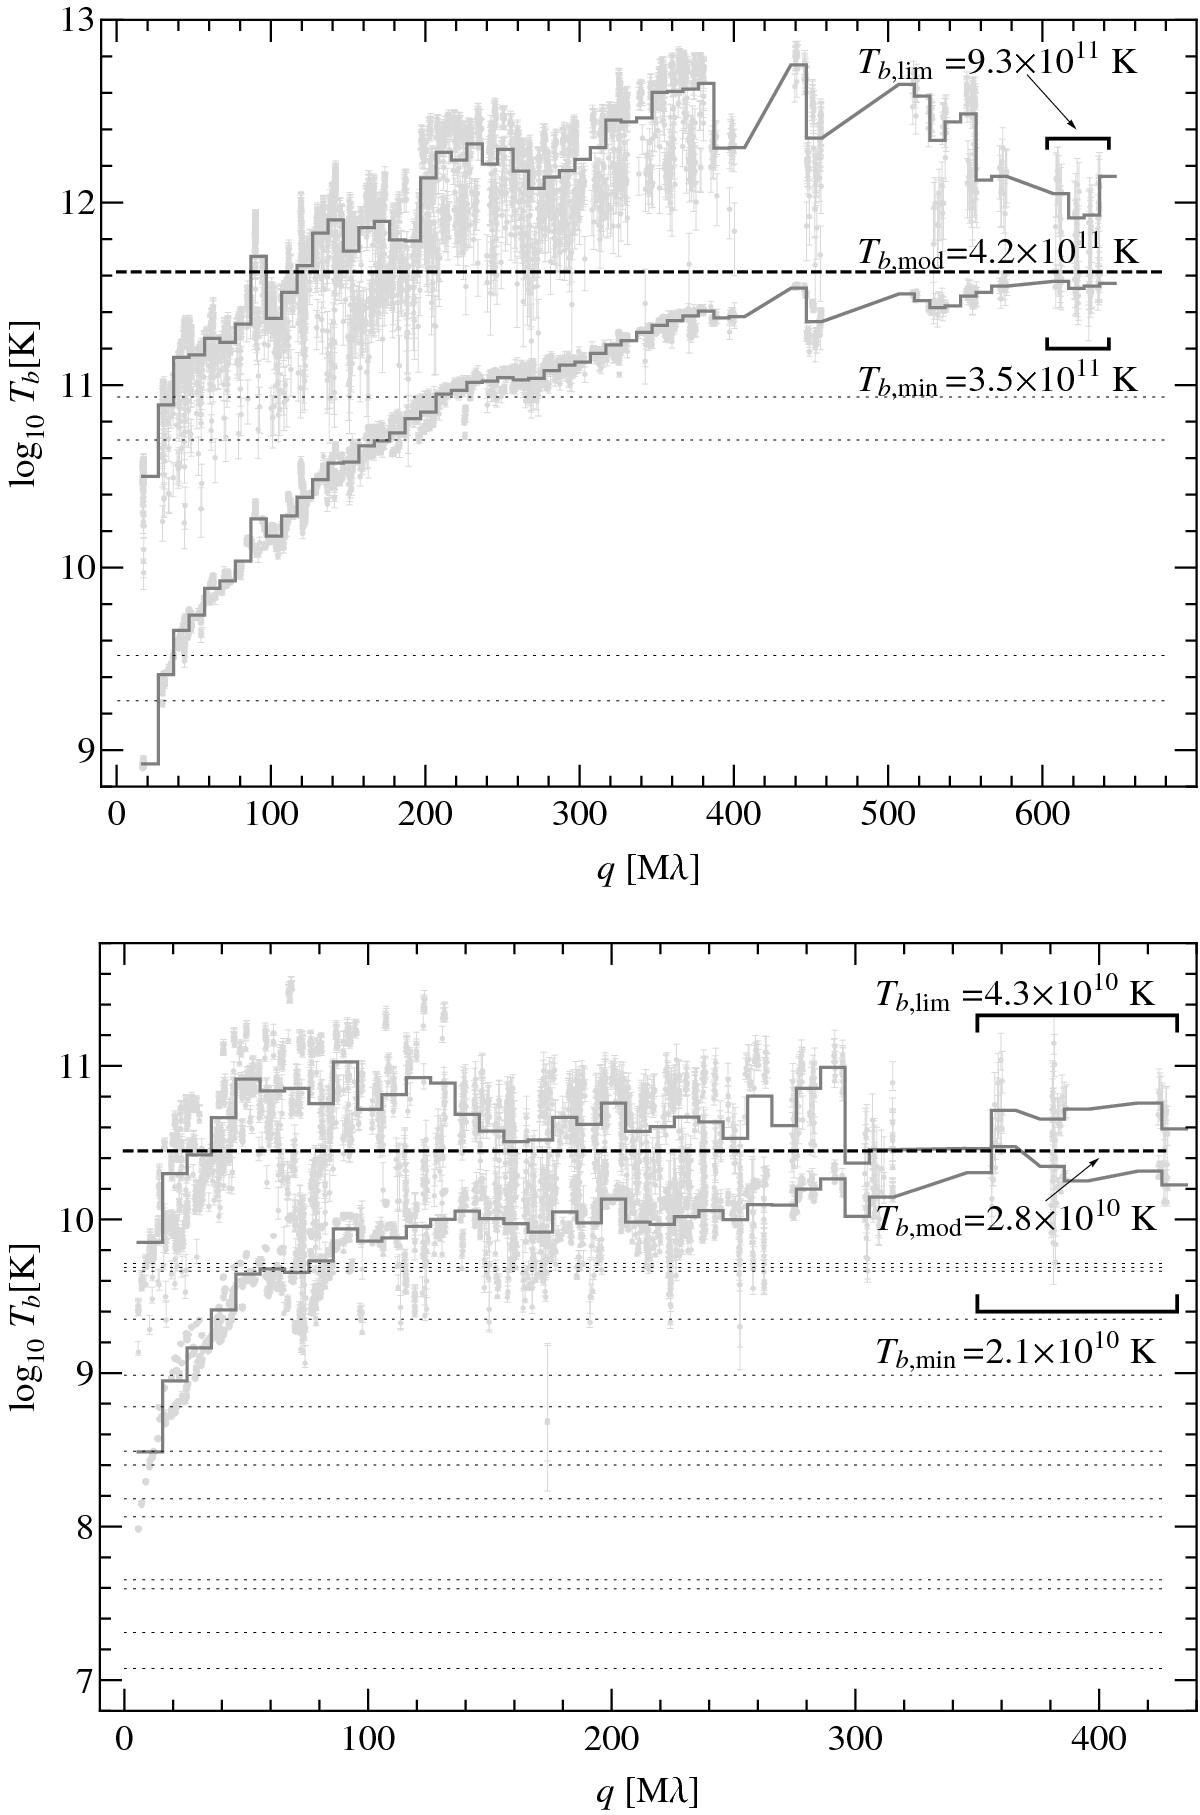
Limiting, Tb,lim (top row of datapoints) and minimum, Tb,min (bottom row of datapoints), brightness temperature estimated directly from visibility data for 3C 345 (top panel) and NGC 1052 (bottom panel), plotted against the spatial frequency q (uv radius). The estimated values are compared with the brightness temperatures of the Gaussian model fit components (dotted lines for the jet components, thick dashed line for the core component) used to describe the source structure as shown in Fig. 2. Running stairs show the respective rows of the brightness temperature averaged within radial bins of 10 Mλ in extent. Both the original and the averaged rows of the brightness temperature indicate that at q ≳ 150 Mλ, the interval [Tb,min,Tb,lim] provides a good bracketing for the maximum brightness temperature in each of the two objects. Braces indicate the conservative ranges of spatial frequency q identified as ranges dominated by the most compact part of the source structure. Averages of Tb,min and Tb,lim made over these ranges constrain the respective Tb,mod estimates well.
Current usage metrics show cumulative count of Article Views (full-text article views including HTML views, PDF and ePub downloads, according to the available data) and Abstracts Views on Vision4Press platform.
Data correspond to usage on the plateform after 2015. The current usage metrics is available 48-96 hours after online publication and is updated daily on week days.
Initial download of the metrics may take a while.