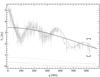
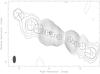
Fig. 2
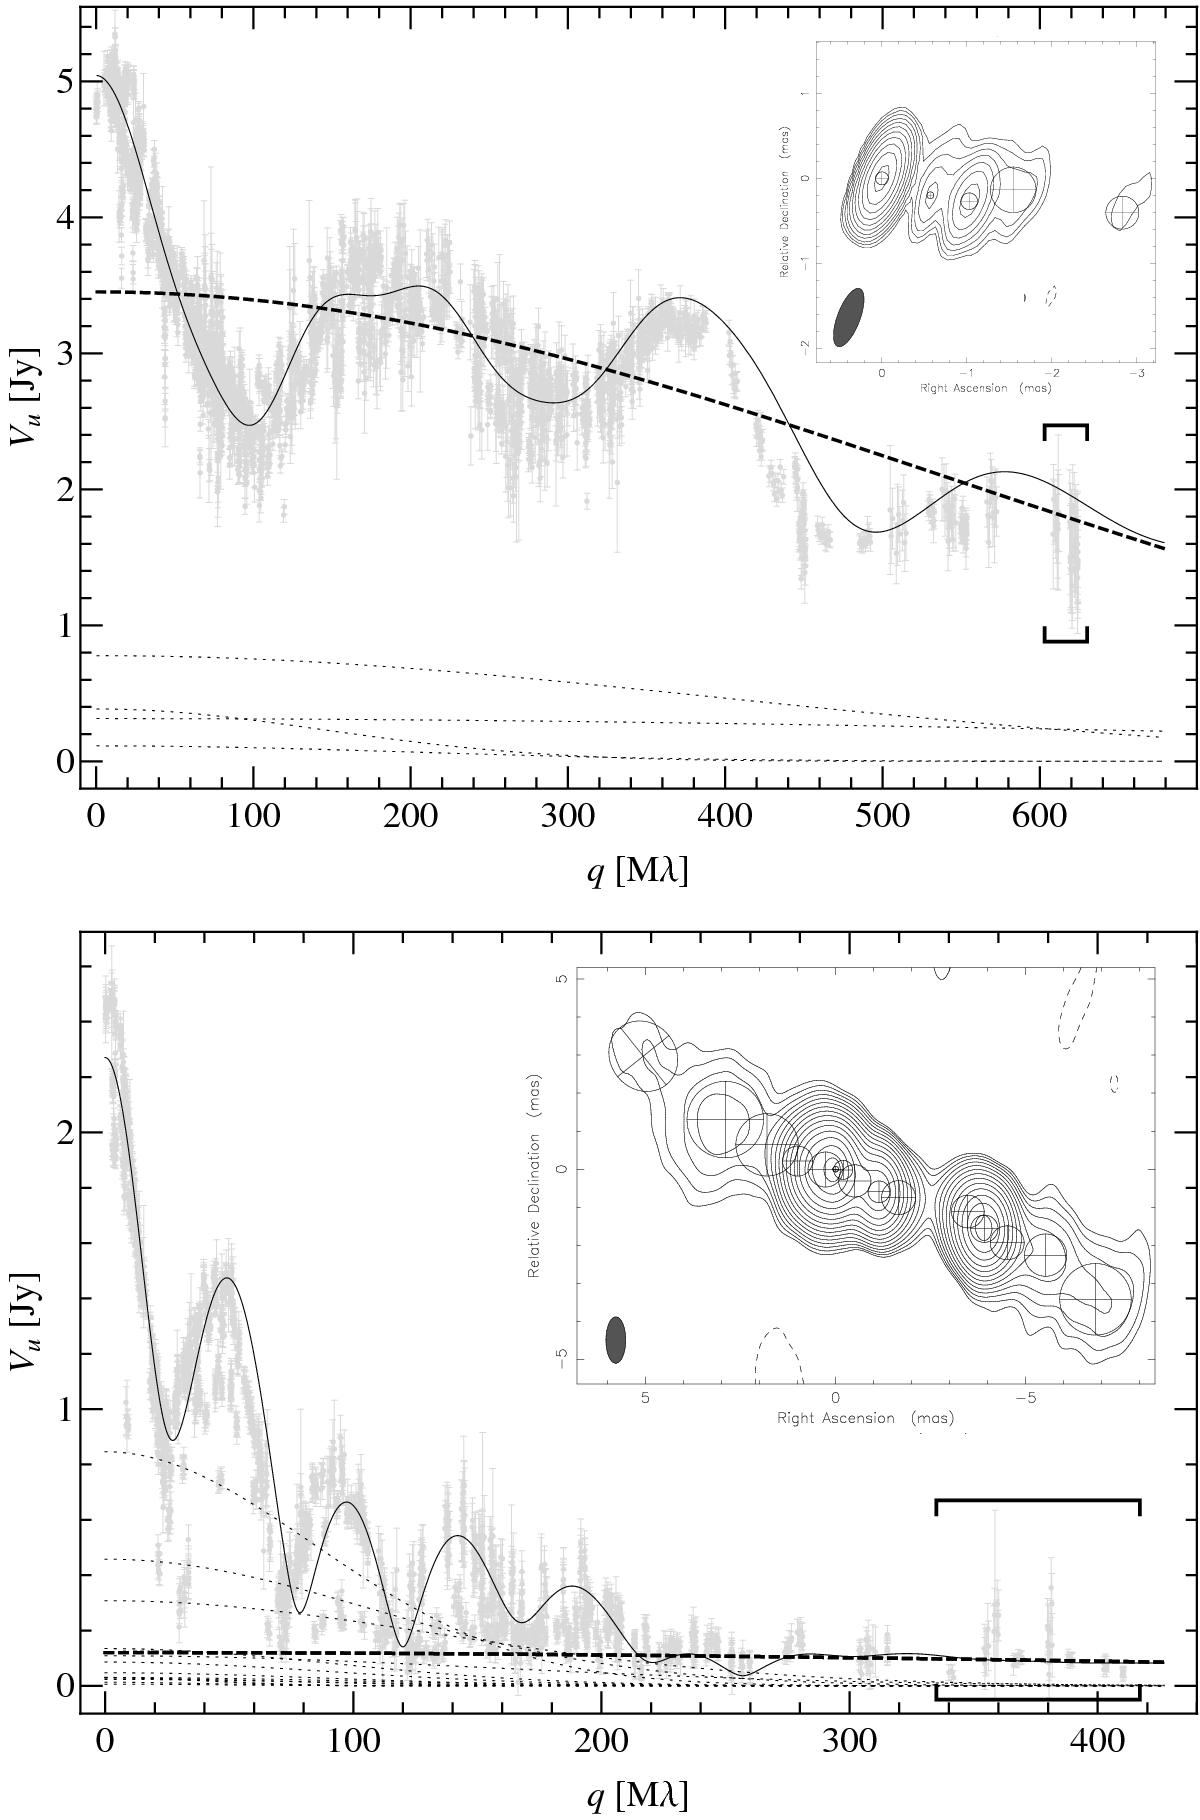
Comparison of the visibility amplitude distribution and Gaussian modelfit representation of the compact structure in a compact structure-dominated object (top, a 22 GHz VLBA observation of the quasar 3C 345 made on 23/08/1999) and an extended structure-dominated object (bottom, a 15 GHz VLBA observation of the radio galaxy NGC 1052 from MOJAVE Survey, made on 16/12/1995; Kellermann et al.2004). The visibility amplitude distributions are projected onto a PA of −104° (3C 345) and −110° (NGC 1052) for illustration purposes, enabling a representation by a single, composite modelfit rather than by fits to individual baselines. The insets show Gaussian modelfit images of the source structure, with component locations and sizes indicated. The resulting fits of the visibility amplitudes are shown by the solid curves. The dotted curves show visibility representations of the individual modelfit components. The thick dashed lines correspond to the respective visibility responses from the most compact “core” component that has the highest brightness temperature. Braces indicate the spatial frequency (uv distance) ranges in which the contribution from the core component dominates the measured visibility amplitude distribution (the uv ranges are measured in units of Mλ, where λ is the observing wavelength). These spatial frequency ranges are best suited to directly estimate the brightness temperature from the visibility measurements.
Current usage metrics show cumulative count of Article Views (full-text article views including HTML views, PDF and ePub downloads, according to the available data) and Abstracts Views on Vision4Press platform.
Data correspond to usage on the plateform after 2015. The current usage metrics is available 48-96 hours after online publication and is updated daily on week days.
Initial download of the metrics may take a while.