Fig. 5
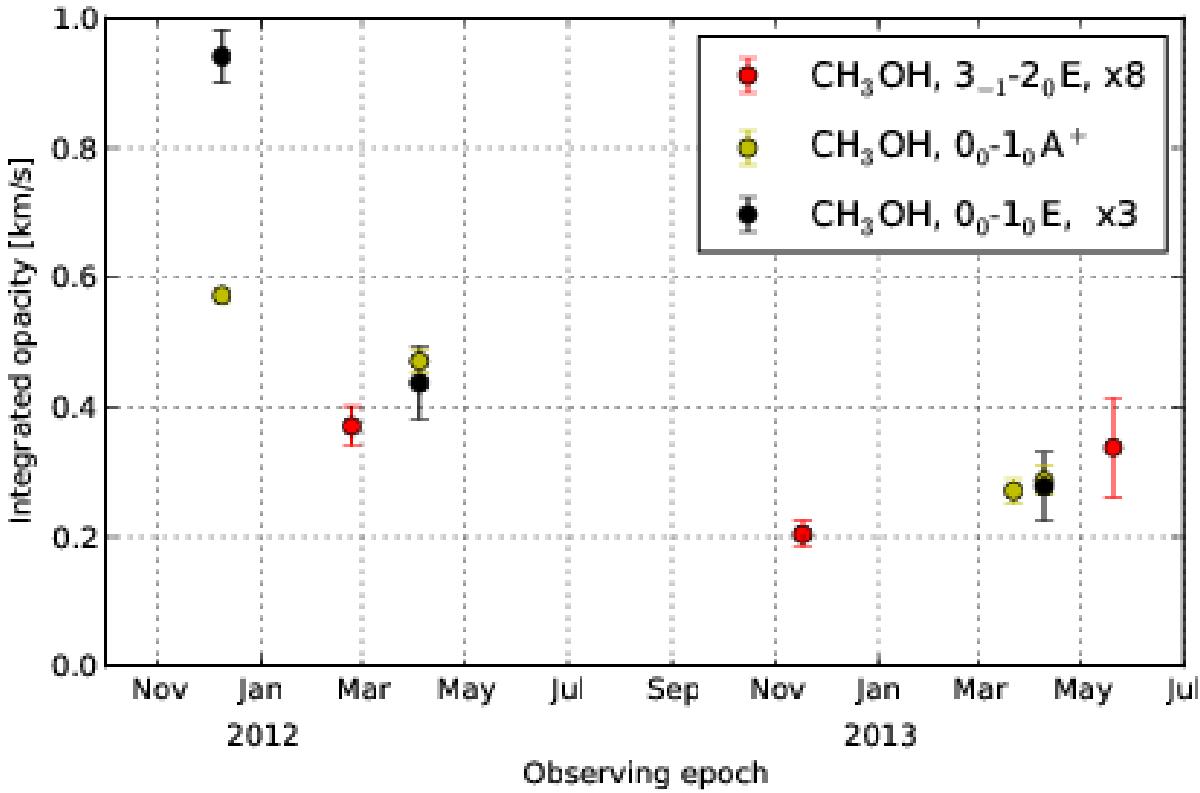
Integrated opacities of three optically thin methanol (CH3OH) transitions adopting a continuum source covering factor fc = 0.38. The data were obtained at Effelsberg (for details, see Bagdonaite et al. 2013a,b) and are shown to demonstrate the decline in opacities during 2012/3 in a qualitative way. The 10 ← 00 E and the 20 ← 3-1 E opacities were multiplied by (arbitrary) factors of 3 and 8, to bring values of all lines to roughly the same y-axis scale. Calibration uncertainties are of order 10% or smaller.
Current usage metrics show cumulative count of Article Views (full-text article views including HTML views, PDF and ePub downloads, according to the available data) and Abstracts Views on Vision4Press platform.
Data correspond to usage on the plateform after 2015. The current usage metrics is available 48-96 hours after online publication and is updated daily on week days.
Initial download of the metrics may take a while.