Fig. 4
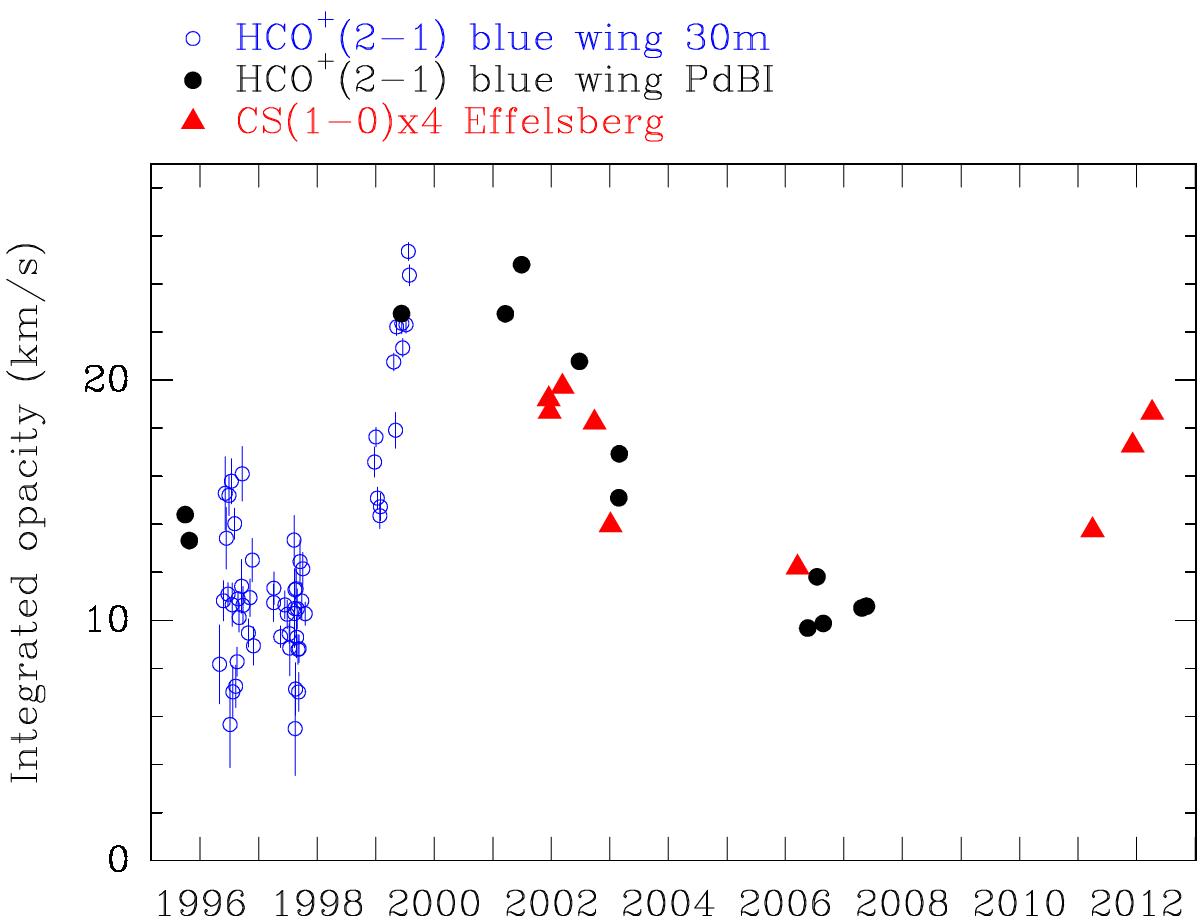
Integrated opacities for fc = 0.38 of the blue wing of the HCO+J = 2 ← 1 lines (−37.6 km s-1<VLSR< −2.6 km s-1; VLSR = VHEL + 12.4 km s-1; z = 0.88582) and of CS J = 1 ← 0 (see also Fig. 3 and Table 3). The HCO+ spectra were taken from IRAM Pico Veleta (30-m) and Plateau de Bure (PdBI) data published by Muller & Guélin (2008). Their calibration uncertainties are 15% and 1%, respectively. For the Effelsberg data, see Sect. 2.
Current usage metrics show cumulative count of Article Views (full-text article views including HTML views, PDF and ePub downloads, according to the available data) and Abstracts Views on Vision4Press platform.
Data correspond to usage on the plateform after 2015. The current usage metrics is available 48-96 hours after online publication and is updated daily on week days.
Initial download of the metrics may take a while.