Fig. 1
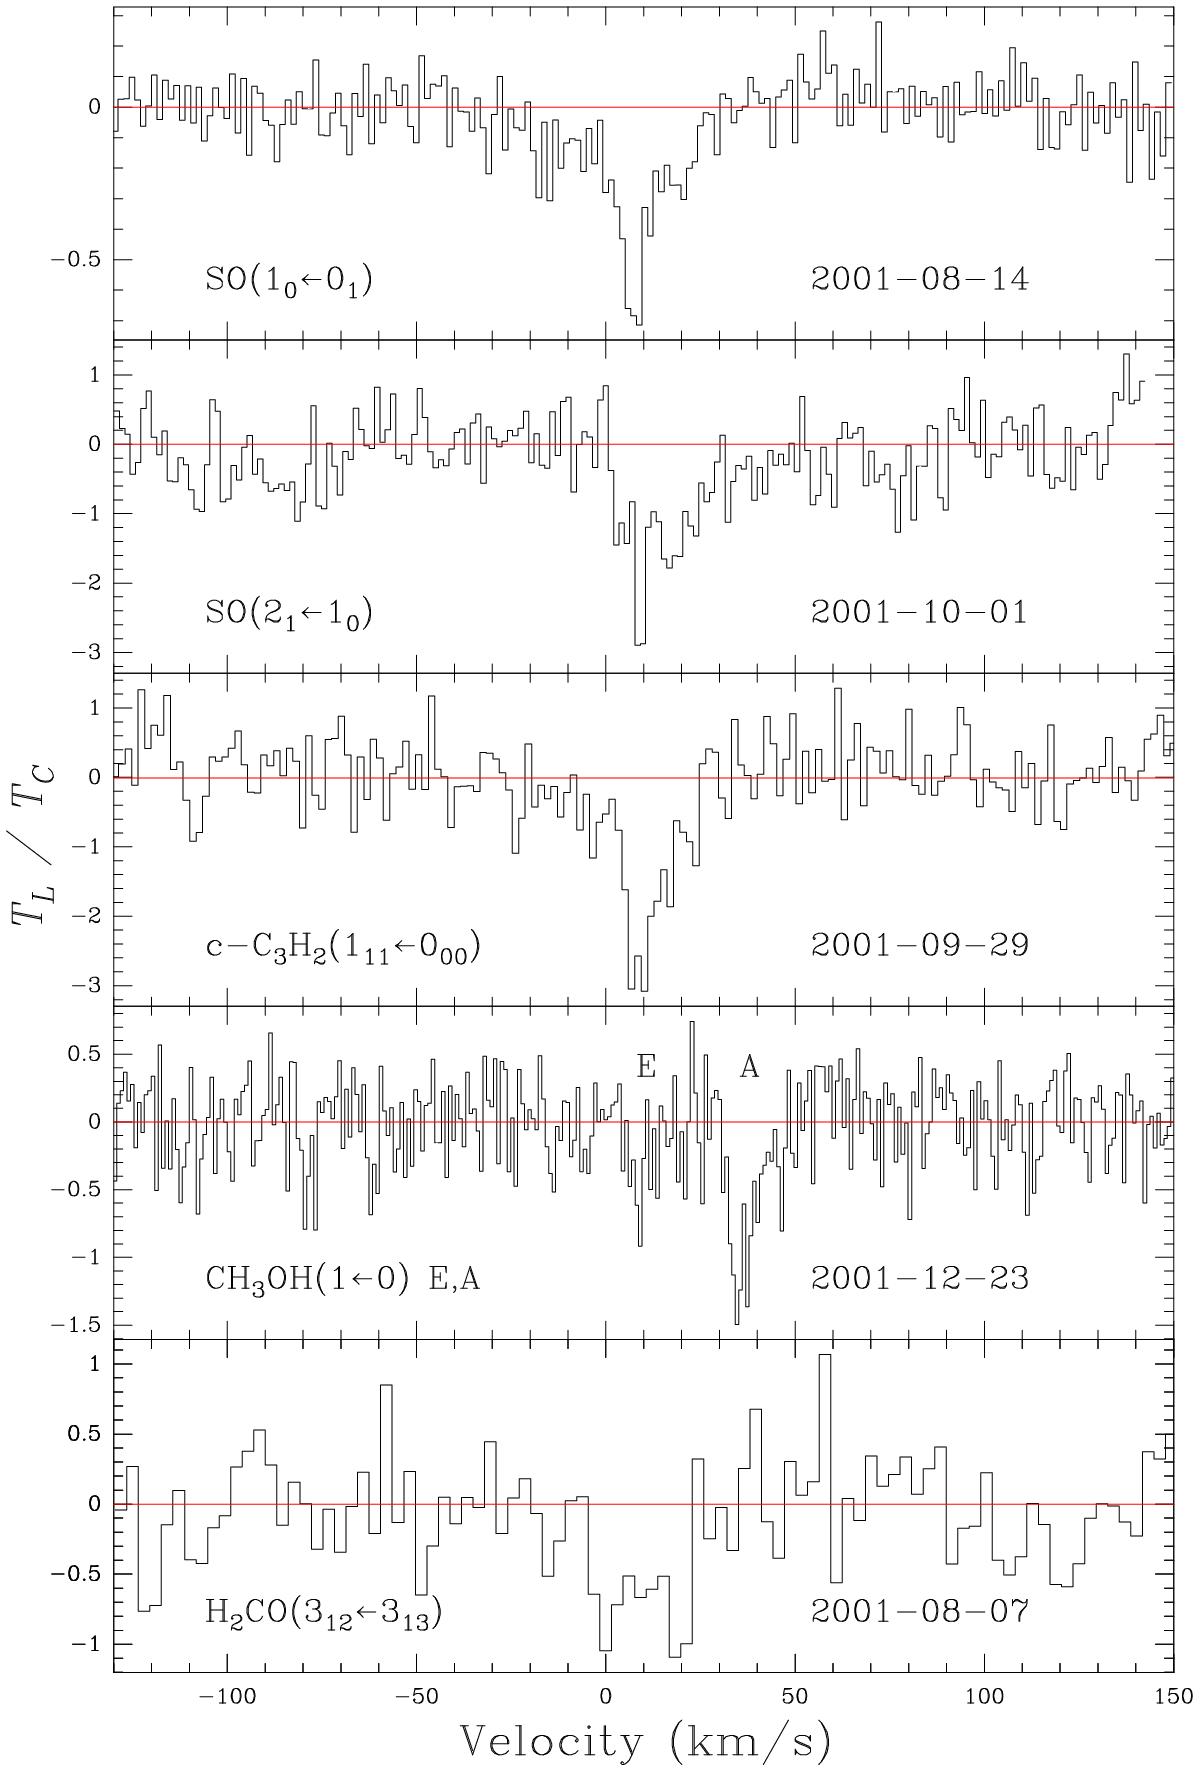
Six absorption lines detected toward PKS 1830–211, displayed in five panels with a local standard of rest (LSR) velocity scale relative to z = 0.88582 (VLSR = VHEL + 12.4 km s-1; ordinate: absorption depth in units of percent of the observed continuum flux density, TC, accounting for the entire source). The spectra were taken between August and December 2001. The velocity scale of the fourth panel from the top is based on the E-transition of methanol (CH3OH). The scale for the A-transition is offset by 27.5 km s-1. The cyclic-C3H2 line of the central panel belongs to the para species (see Table 2). Channel spacings are 1.4, 1.4, 1.7, 0.9 and 3.0 km s-1from top to bottom.
Current usage metrics show cumulative count of Article Views (full-text article views including HTML views, PDF and ePub downloads, according to the available data) and Abstracts Views on Vision4Press platform.
Data correspond to usage on the plateform after 2015. The current usage metrics is available 48-96 hours after online publication and is updated daily on week days.
Initial download of the metrics may take a while.