Free Access
Fig. 9
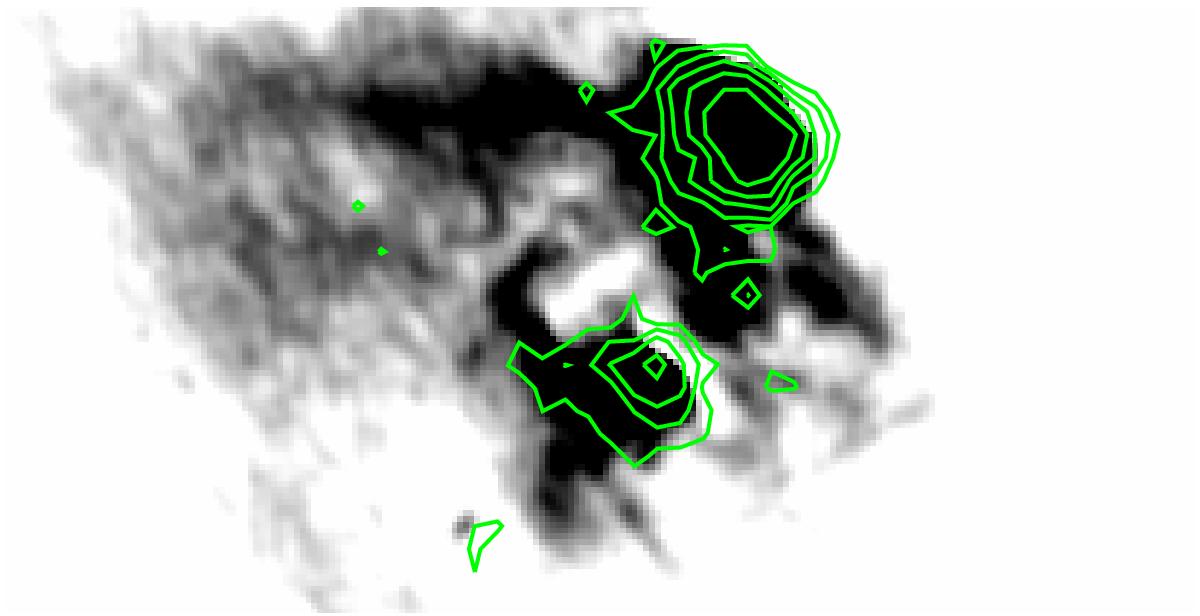
Same as Fig. 8 but now optimized for studying LHS2. The contours are logarithmically spaced between 13 and 70 counts. We note the weak radio and completely offset X-ray emission, which might be a jet knot or a very young hotspot.
Current usage metrics show cumulative count of Article Views (full-text article views including HTML views, PDF and ePub downloads, according to the available data) and Abstracts Views on Vision4Press platform.
Data correspond to usage on the plateform after 2015. The current usage metrics is available 48-96 hours after online publication and is updated daily on week days.
Initial download of the metrics may take a while.