Free Access
Fig. 8
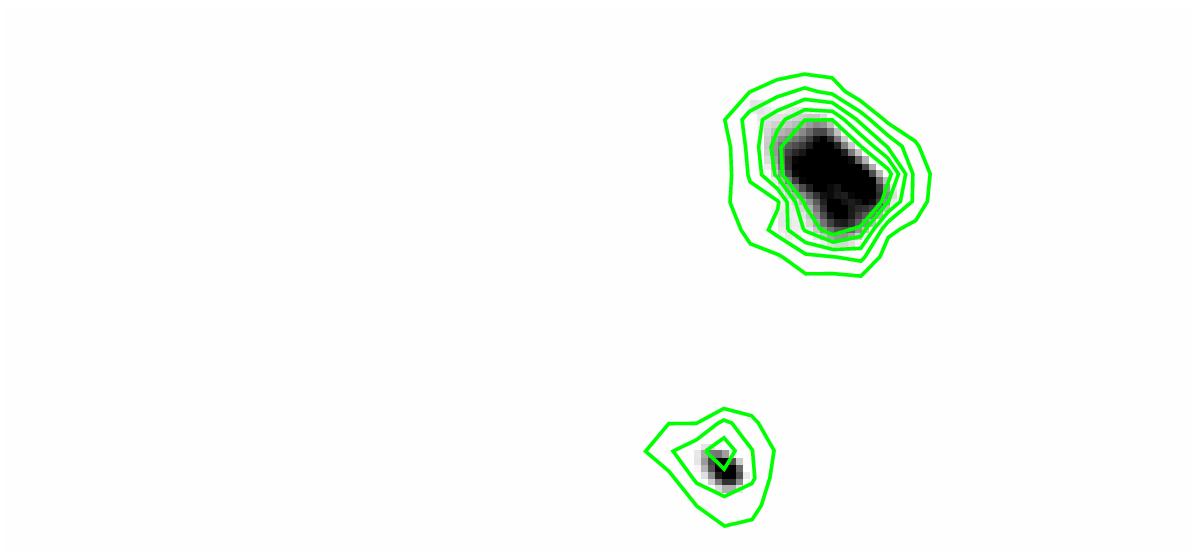
15 GHz image of the hotspots in the lobe with the Chandra 0.2−10 keV contours overlaid. The contour levels are logarithmically spaced and between 20 and 70 counts. The grayscale is optimized to see any potential shift in emission for the secondary hotspot.
Current usage metrics show cumulative count of Article Views (full-text article views including HTML views, PDF and ePub downloads, according to the available data) and Abstracts Views on Vision4Press platform.
Data correspond to usage on the plateform after 2015. The current usage metrics is available 48-96 hours after online publication and is updated daily on week days.
Initial download of the metrics may take a while.