Free Access
Fig. 14
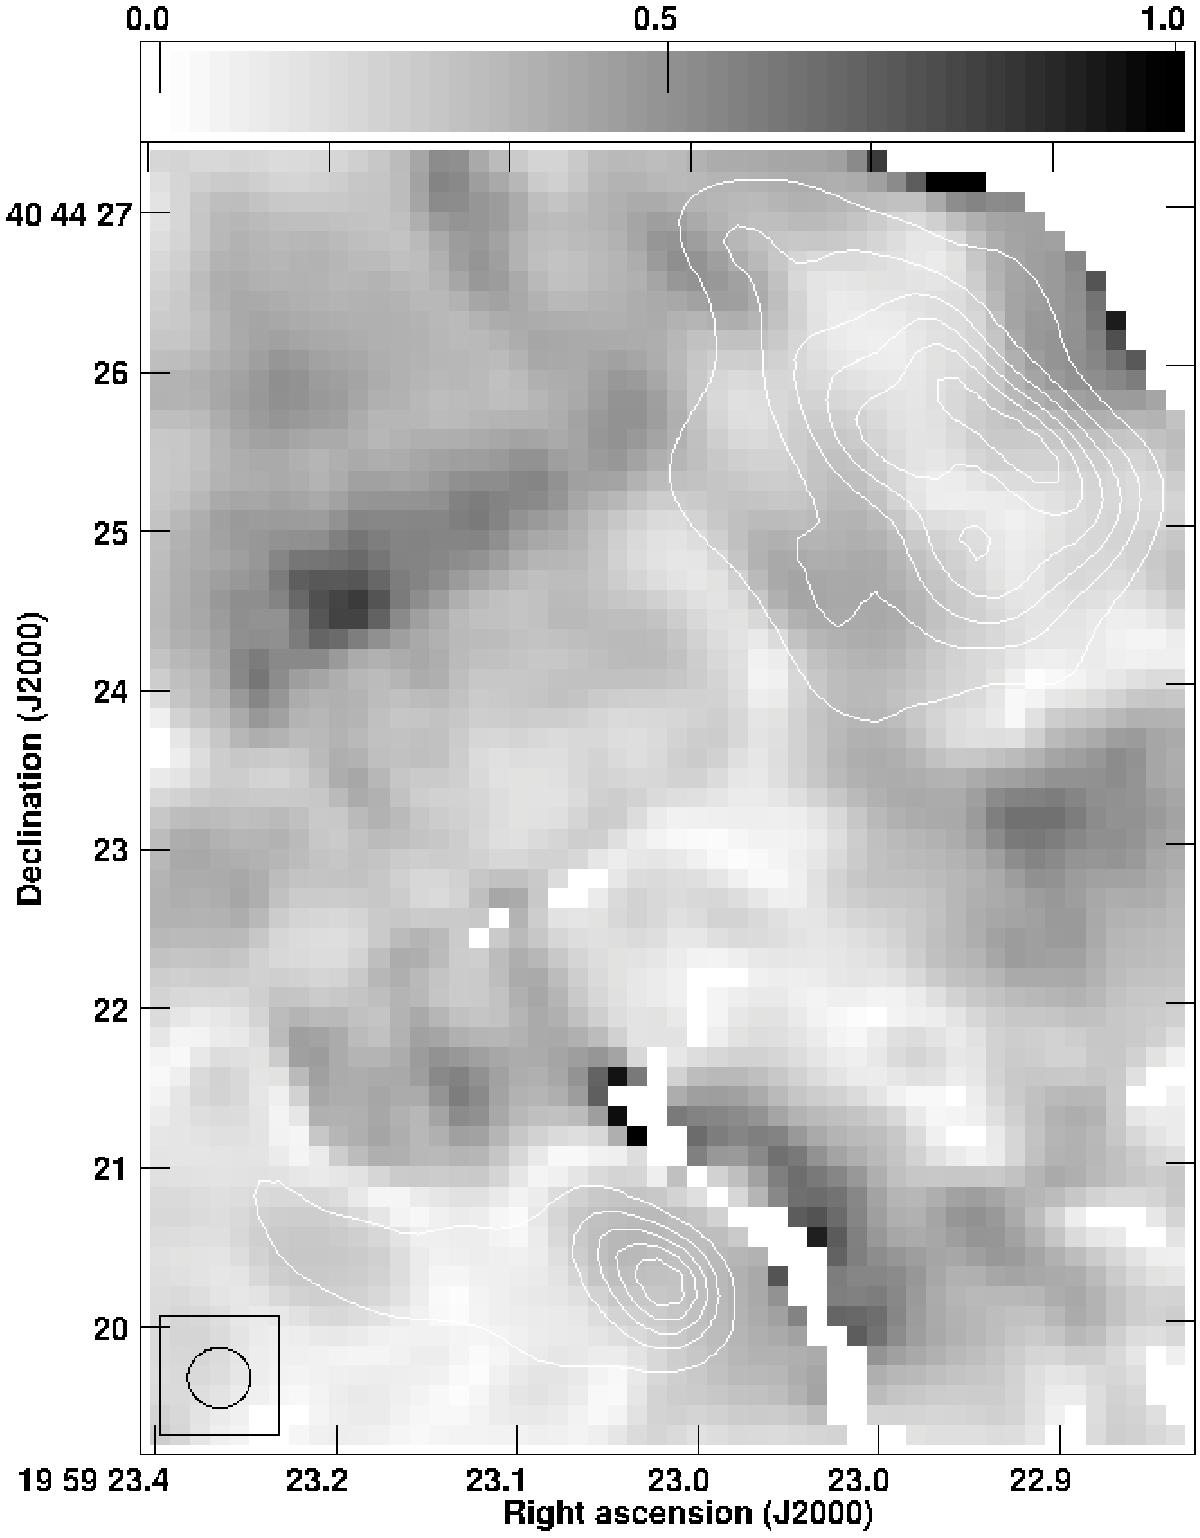
Fractional polarization image of the lobe at 15 GHz. We overplot the 15 GHz data as contours, to aid the eye in the identification of the hotspots position. Certain pixels were blanked and appear white; for these pixels the polarized flux value was nominally larger than the unpolarized value, most likely a data artifact.
Current usage metrics show cumulative count of Article Views (full-text article views including HTML views, PDF and ePub downloads, according to the available data) and Abstracts Views on Vision4Press platform.
Data correspond to usage on the plateform after 2015. The current usage metrics is available 48-96 hours after online publication and is updated daily on week days.
Initial download of the metrics may take a while.