Free Access
Fig. 12
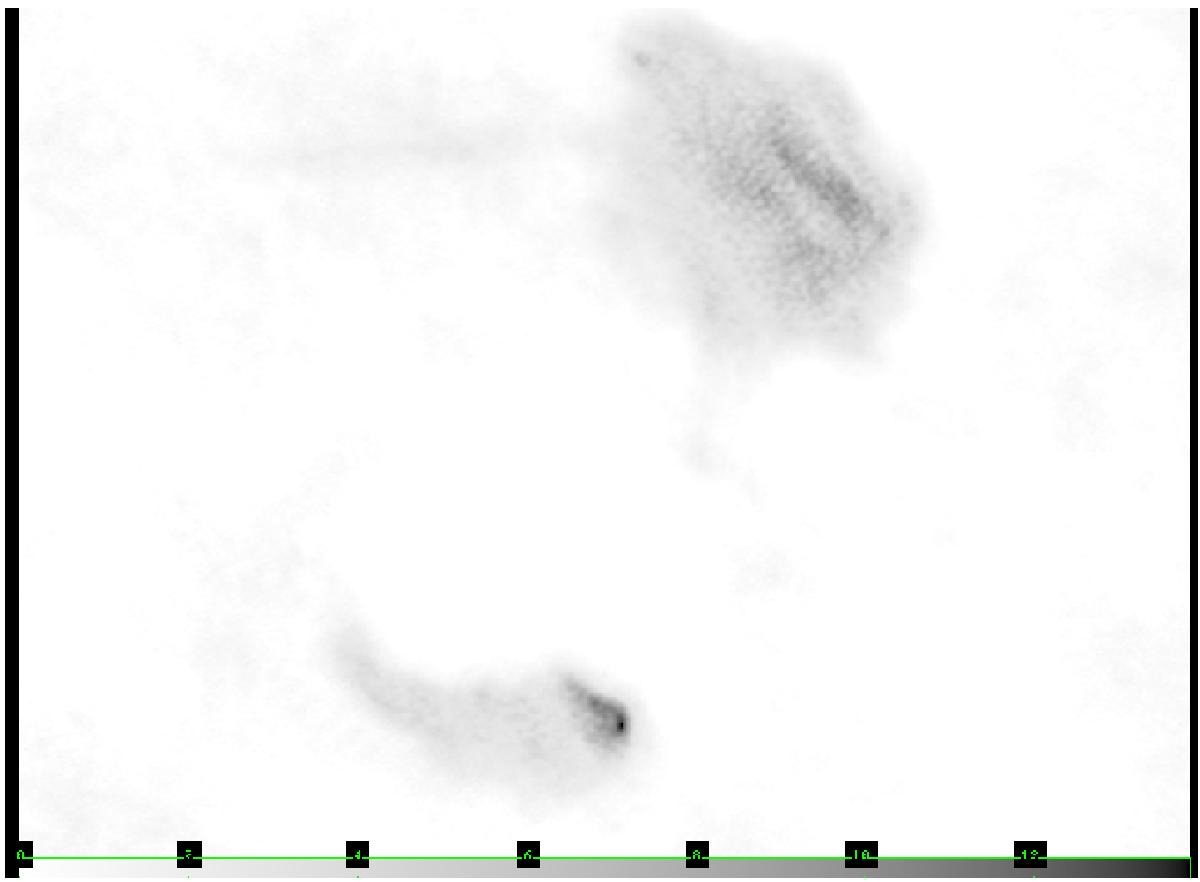
The 43 GHz flux observed in Stokes I, detailing the two hotspots in the lobe. In LHS1 two linear substructures, which could be linear shockfronts, can be observed. In LHS2 a bright point is visible with a weaker linear structure above it, extending to the NE.
Current usage metrics show cumulative count of Article Views (full-text article views including HTML views, PDF and ePub downloads, according to the available data) and Abstracts Views on Vision4Press platform.
Data correspond to usage on the plateform after 2015. The current usage metrics is available 48-96 hours after online publication and is updated daily on week days.
Initial download of the metrics may take a while.