Fig. 10
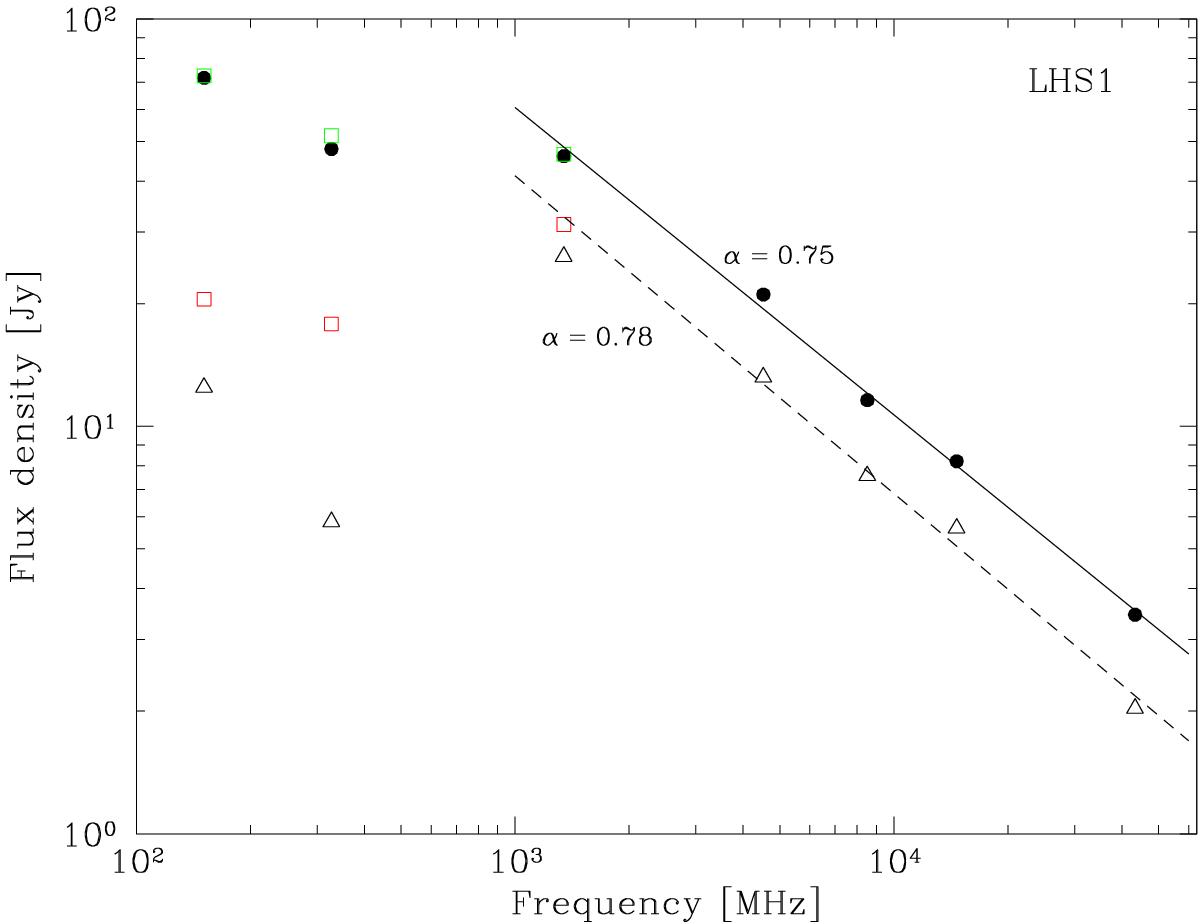
Flux density measurements for LHS1. Filled circles correspond to the original flux measurements, open triangles to the background corrected ones. Green open squares are measurements after repositioning the reference photometry aperture, while red open squares are the corresponding background corrected values. The straight line is a linear fit to the original flux measurements, the dashed line is a linear fit to the background corrected ones.
Current usage metrics show cumulative count of Article Views (full-text article views including HTML views, PDF and ePub downloads, according to the available data) and Abstracts Views on Vision4Press platform.
Data correspond to usage on the plateform after 2015. The current usage metrics is available 48-96 hours after online publication and is updated daily on week days.
Initial download of the metrics may take a while.