Fig. 4
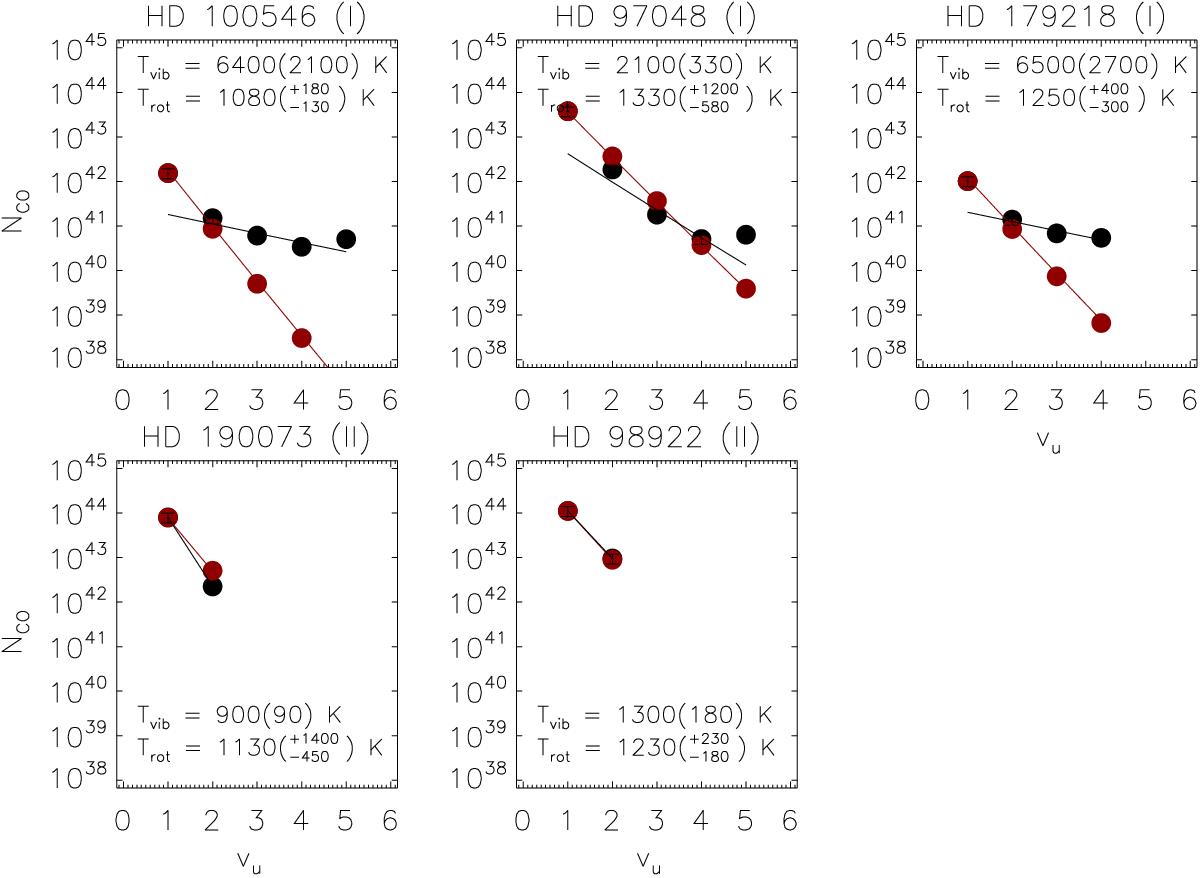
Best fit vibrational (black lines) and rotational (red lines) temperatures for sources with at least vup = 1, 2 detected. The target name and disk classification (group I/II) are given in each plot title. Black points show the total amount of CO molecules per vibrational band needed to explain the detected flux assuming the distance listed in Table 1 and an averaged CO column and Trot. Red points show an LTE distribution calculated for the averaged Trot. Both sets are normalized on vu = 1. The errors for the rotational temperatures are 1σ best fit contours of the summed best fit contour for all vibrational bands per source. Calculated vibrational temperature errors are 1σ values adopting a relative error of 25% in N(CO).
Current usage metrics show cumulative count of Article Views (full-text article views including HTML views, PDF and ePub downloads, according to the available data) and Abstracts Views on Vision4Press platform.
Data correspond to usage on the plateform after 2015. The current usage metrics is available 48-96 hours after online publication and is updated daily on week days.
Initial download of the metrics may take a while.