Free Access
Fig. 9
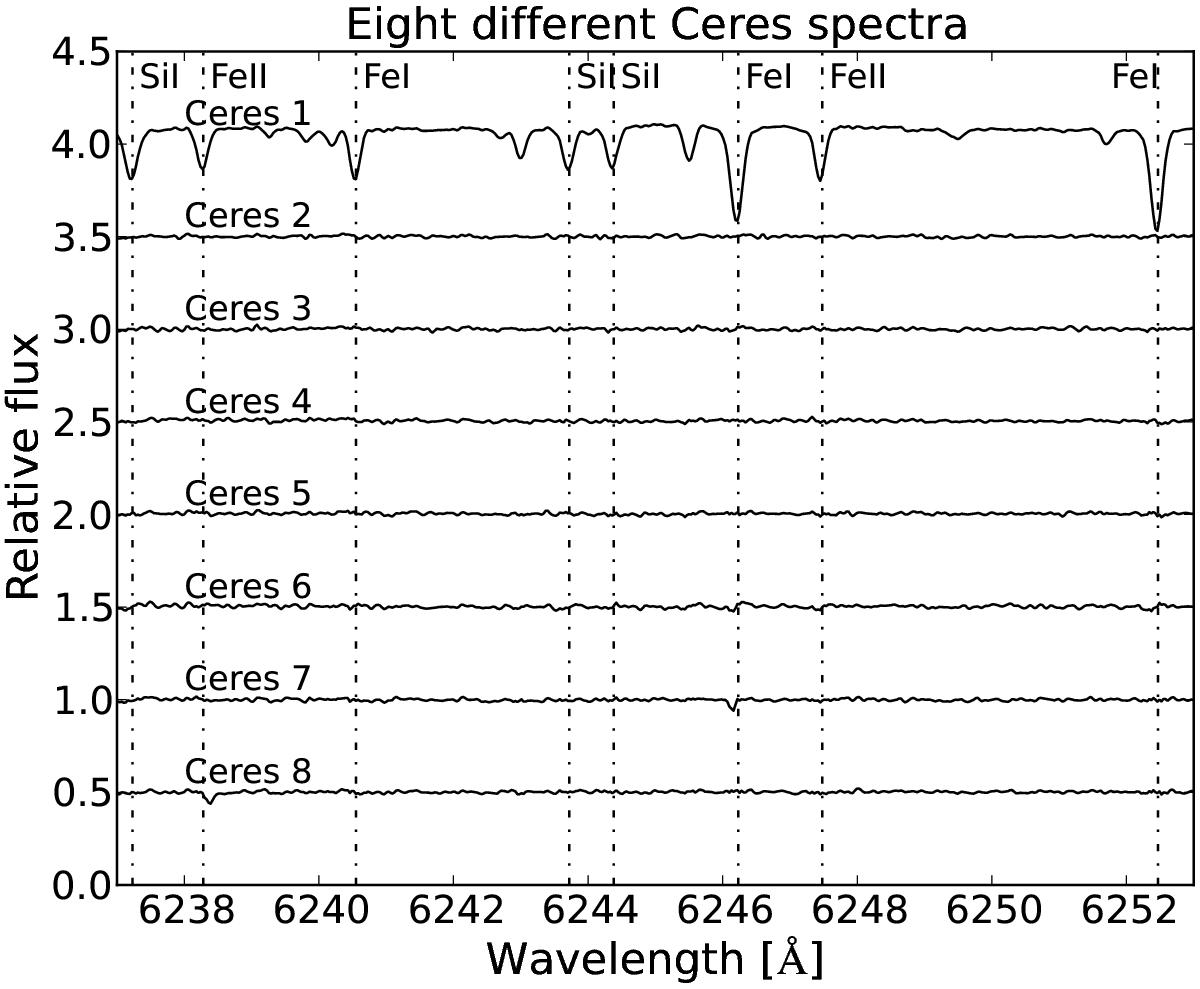
Small-wavelength window for all eight Ceres spectra taken during the December 2012 run (FE14 sample). It shows one spectrum and seven residual spectra, subtracted from the first.
Current usage metrics show cumulative count of Article Views (full-text article views including HTML views, PDF and ePub downloads, according to the available data) and Abstracts Views on Vision4Press platform.
Data correspond to usage on the plateform after 2015. The current usage metrics is available 48-96 hours after online publication and is updated daily on week days.
Initial download of the metrics may take a while.