Fig. 8
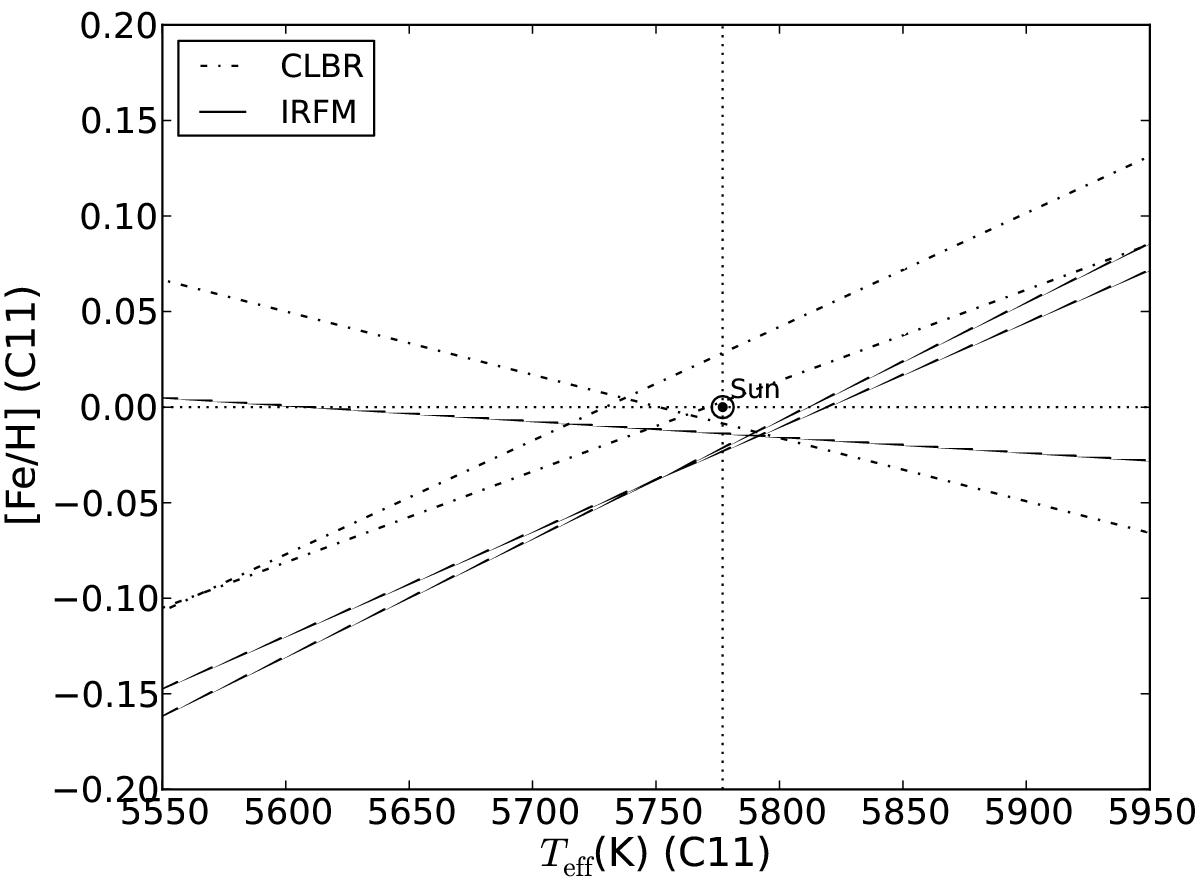
Degeneracy lines for the two subsamples in the C11. Stars that used IRFM calibrations, and stars that used CLBR calibrations. The lines of one type intersect at the point where the Sun would be in the sample. We also plot in comparison where the Sun really is, which is within the error of both samples. For clarity, we do not plot the errors.
Current usage metrics show cumulative count of Article Views (full-text article views including HTML views, PDF and ePub downloads, according to the available data) and Abstracts Views on Vision4Press platform.
Data correspond to usage on the plateform after 2015. The current usage metrics is available 48-96 hours after online publication and is updated daily on week days.
Initial download of the metrics may take a while.