Free Access
Fig. 5
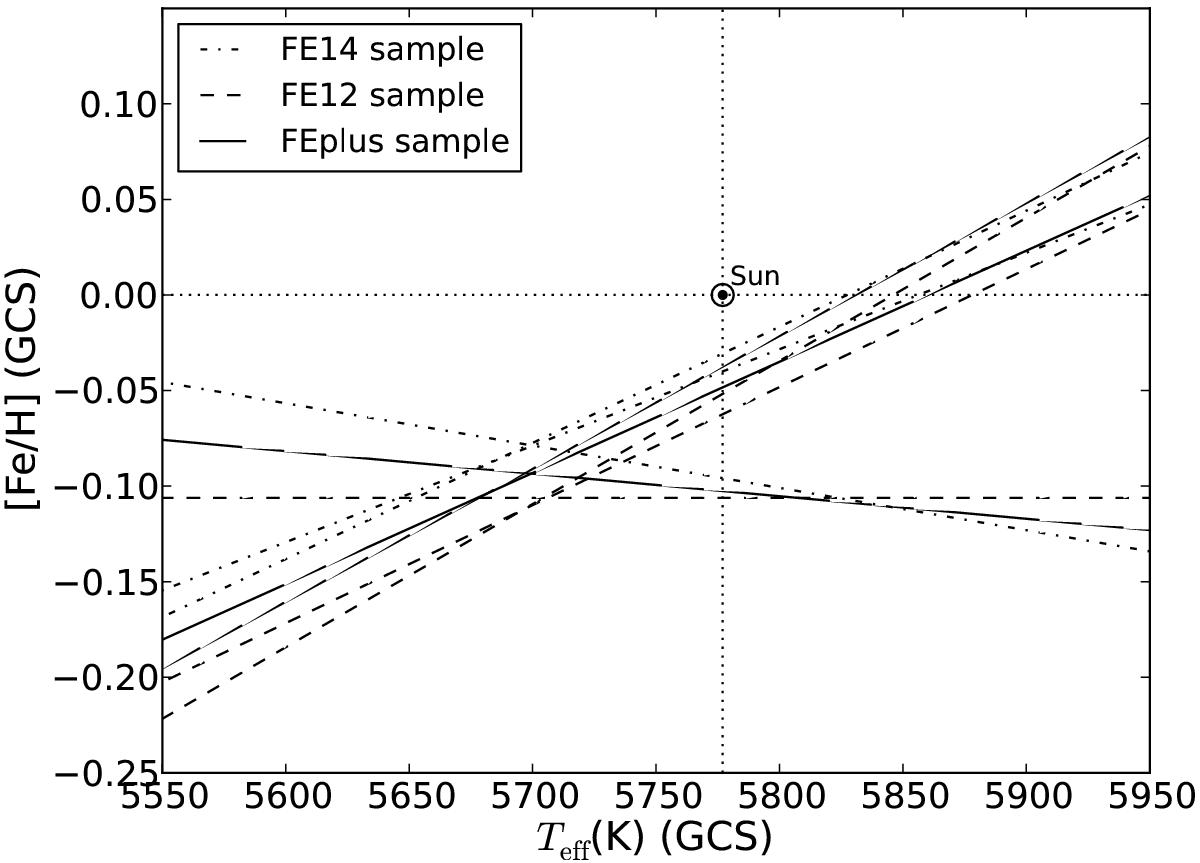
Degeneracy lines for the FE12, FE14, and FEplus samples, using GCS-III values for effective temperature and metallicity. Clearly, the intersection of the lines does not change with sample within the errors. For clarity, we do not plot the error bands.
Current usage metrics show cumulative count of Article Views (full-text article views including HTML views, PDF and ePub downloads, according to the available data) and Abstracts Views on Vision4Press platform.
Data correspond to usage on the plateform after 2015. The current usage metrics is available 48-96 hours after online publication and is updated daily on week days.
Initial download of the metrics may take a while.