Fig. 4
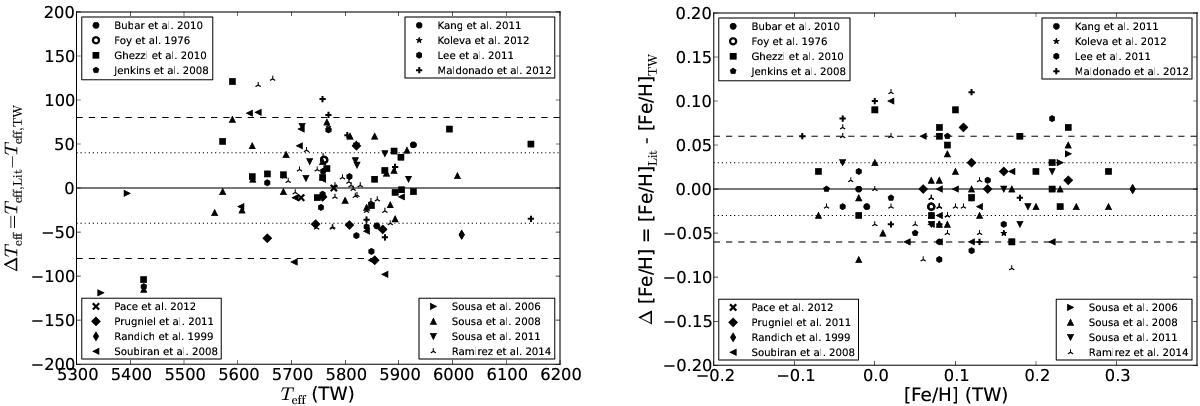
Figures 4a and b show how the spectroscopic literature values of 76 of our stars compare to our determined values for effective temperature and metallicity. Both cases show literature values (Lit) minus the values determined in this work (TW). The horizontal lines show the 1σ and 2σ scatter in our values. We find no significant trends or offsets.
Current usage metrics show cumulative count of Article Views (full-text article views including HTML views, PDF and ePub downloads, according to the available data) and Abstracts Views on Vision4Press platform.
Data correspond to usage on the plateform after 2015. The current usage metrics is available 48-96 hours after online publication and is updated daily on week days.
Initial download of the metrics may take a while.