Fig. 3
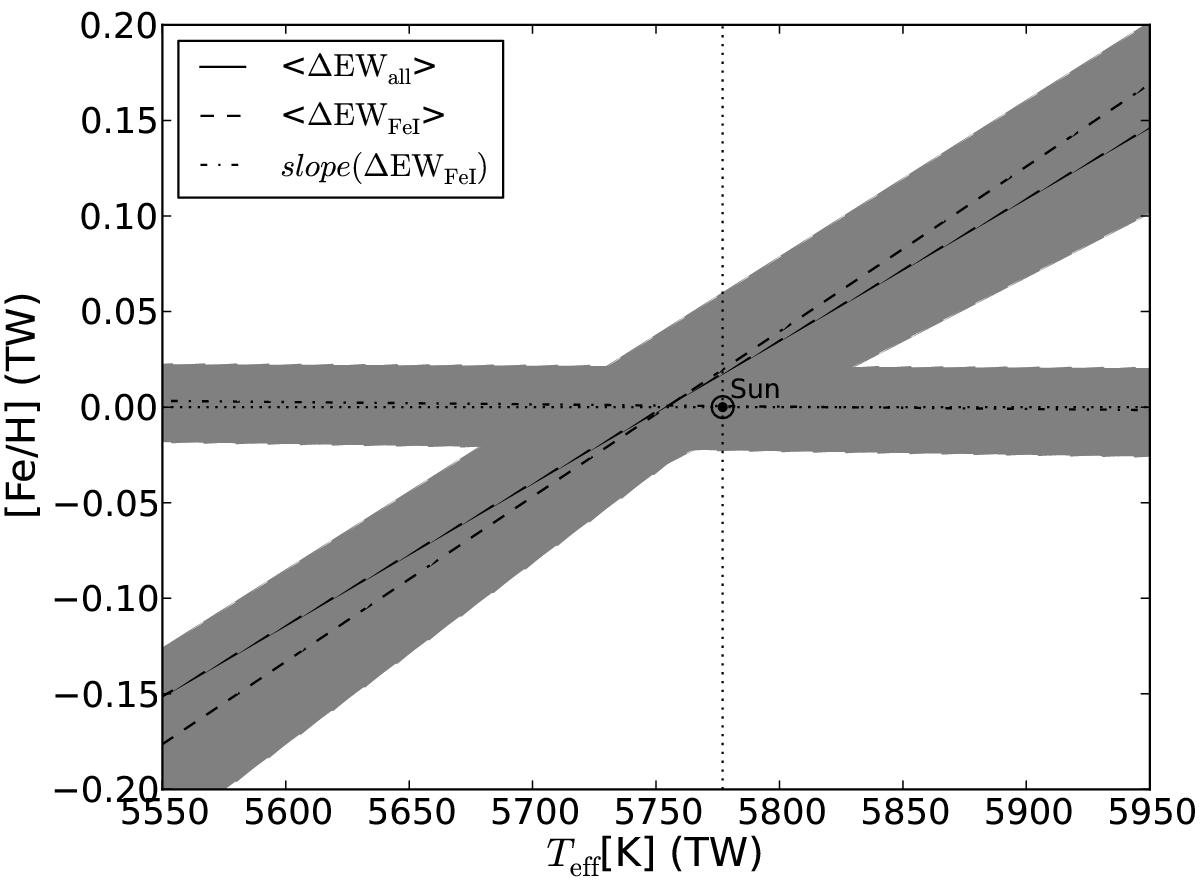
Solar zero point for the degeneracy lines analysis of the FEplus sample using our spectroscopic values for Teff and [Fe/H] from this work (TW). It is clear that the crossing point of the lines falls close to the solar zero-point, thus showing that our values are well centred on the Sun. Shaded areas show the 1σ scatter in the lines.
Current usage metrics show cumulative count of Article Views (full-text article views including HTML views, PDF and ePub downloads, according to the available data) and Abstracts Views on Vision4Press platform.
Data correspond to usage on the plateform after 2015. The current usage metrics is available 48-96 hours after online publication and is updated daily on week days.
Initial download of the metrics may take a while.