Fig. 1
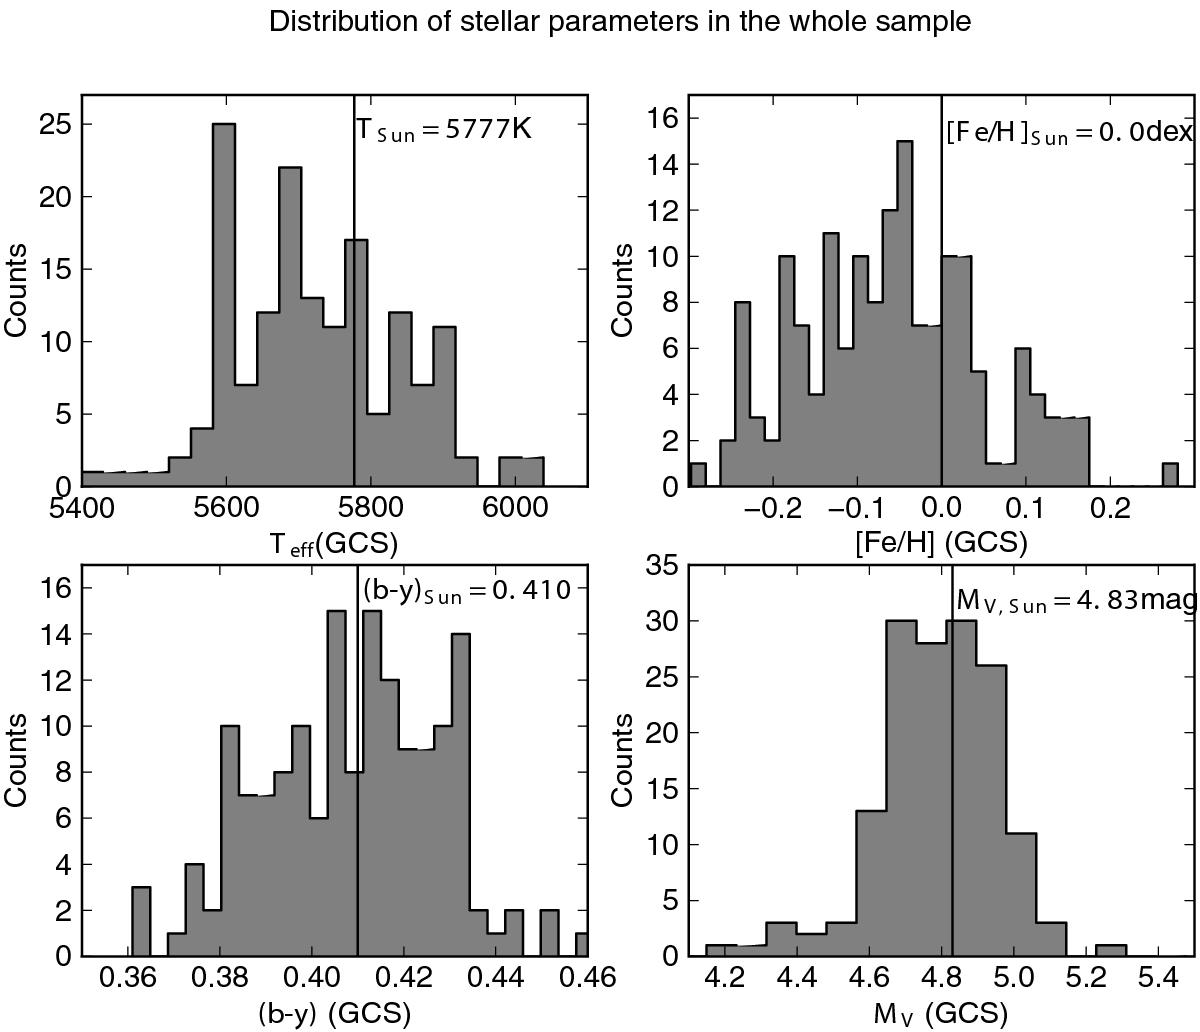
Distribution of stellar parameters in the combined FEplus sample. The top two panels show values from the GCS in the shaded histograms and the values from our own spectroscopic determinations as the dashed histograms. The bottom two panels show values from the GCS for (b − y) and Hipparcos for MV. Vertical black lines show our adopted solar values of all four parameters. We quote a solar (b − y) colour that we found in previous work (D12 and D14) and not the lower value by Holmberg et al. (2006).
Current usage metrics show cumulative count of Article Views (full-text article views including HTML views, PDF and ePub downloads, according to the available data) and Abstracts Views on Vision4Press platform.
Data correspond to usage on the plateform after 2015. The current usage metrics is available 48-96 hours after online publication and is updated daily on week days.
Initial download of the metrics may take a while.