Free Access
Fig. 4
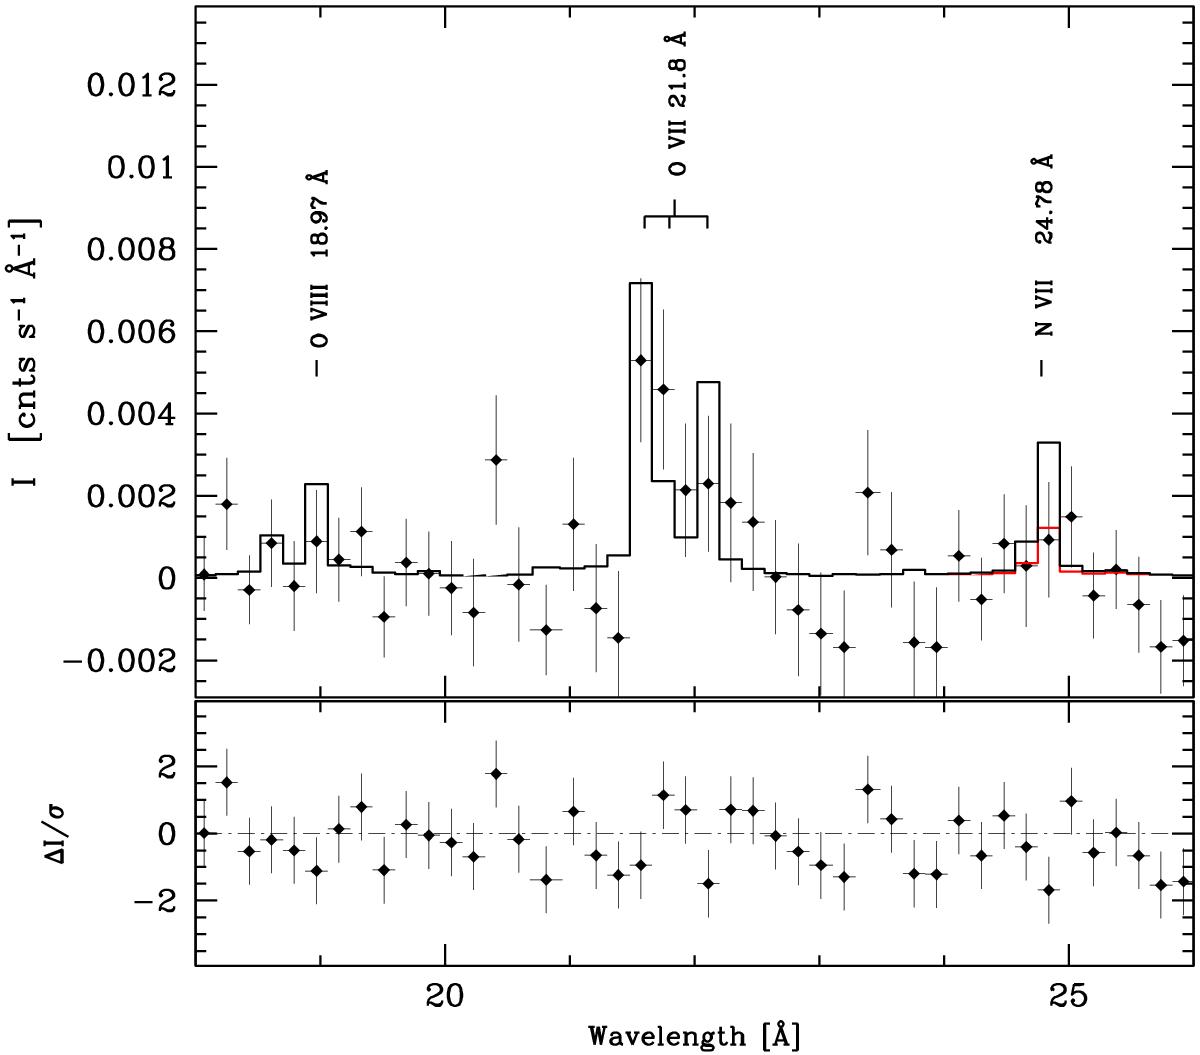
Same as Fig. 3, but for a bin size of 0.09 Å. The O vii triplet is resolved in this spectrum. The black histogram corresponds to an optically thin plasma emission model with nebular abundances and a temperature of 0.147 keV. The red histogram, as in the previous figure, considers a solar N/O ratio.
Current usage metrics show cumulative count of Article Views (full-text article views including HTML views, PDF and ePub downloads, according to the available data) and Abstracts Views on Vision4Press platform.
Data correspond to usage on the plateform after 2015. The current usage metrics is available 48-96 hours after online publication and is updated daily on week days.
Initial download of the metrics may take a while.