Fig. 3
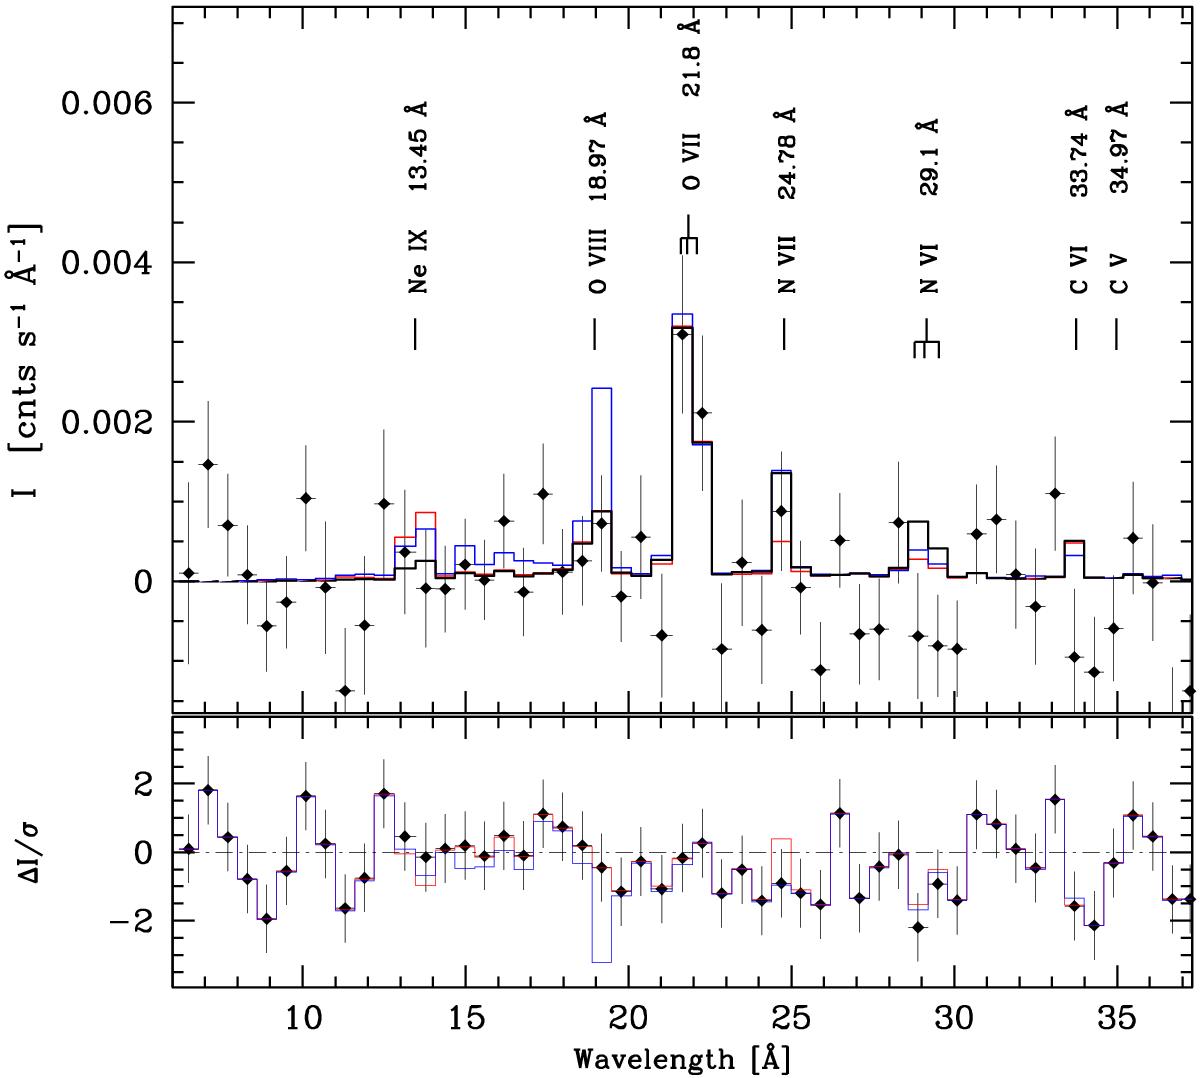
Top panel: combined low-background (bottom panel of Fig. 2) background-subtracted RGS spectrum of NGC 6543 overplotted by histograms of optically thin plasma emission models: black – model with nebular abundances and a temperature of 0.147 keV, blue – model with nebular abundances and a temperature of 0.19 keV, and red – model with enhanced Ne and depleted N abundances and temperature 0.147 keV. The intensity of each model has been normalized to that of the O vii triplet at 22 Å. Bottom panel: residuals of the models. The colors correspond to the same models as in the top panel.
Current usage metrics show cumulative count of Article Views (full-text article views including HTML views, PDF and ePub downloads, according to the available data) and Abstracts Views on Vision4Press platform.
Data correspond to usage on the plateform after 2015. The current usage metrics is available 48-96 hours after online publication and is updated daily on week days.
Initial download of the metrics may take a while.