Free Access
Fig. 1
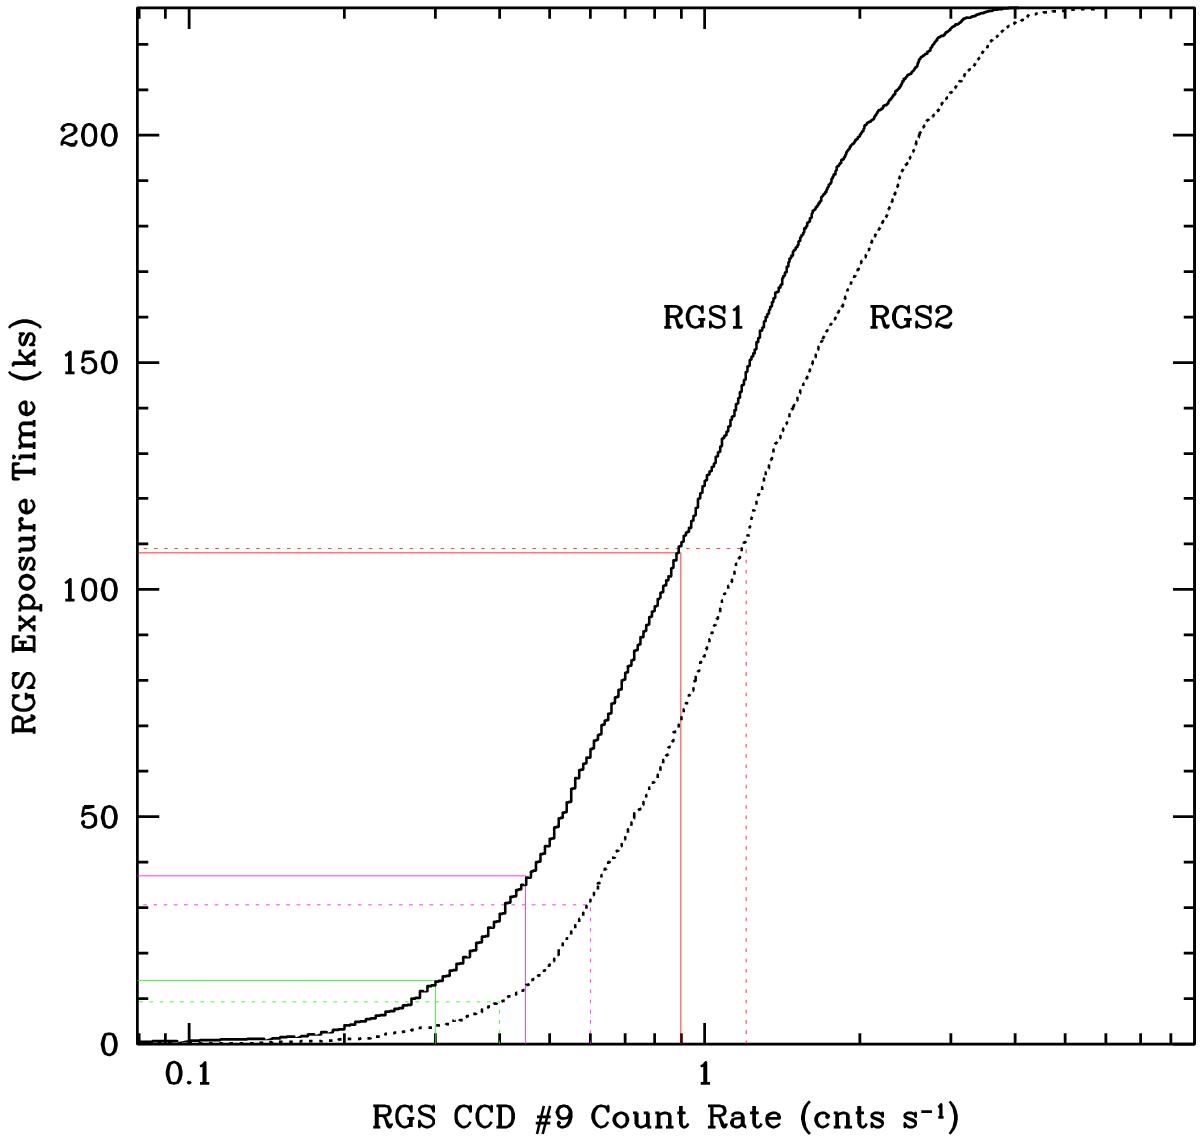
Cumulative frequency of the RGS1 (solid line) and RGS2 (dotted line) CCD #9 count rate in the 10–12 keV energy range. The horizontal red, purple, and green lines mark the levels of CCD #9 count rates adopted as high, moderate, and low background levels, respectively, for spectra extraction.
Current usage metrics show cumulative count of Article Views (full-text article views including HTML views, PDF and ePub downloads, according to the available data) and Abstracts Views on Vision4Press platform.
Data correspond to usage on the plateform after 2015. The current usage metrics is available 48-96 hours after online publication and is updated daily on week days.
Initial download of the metrics may take a while.