Fig. 4
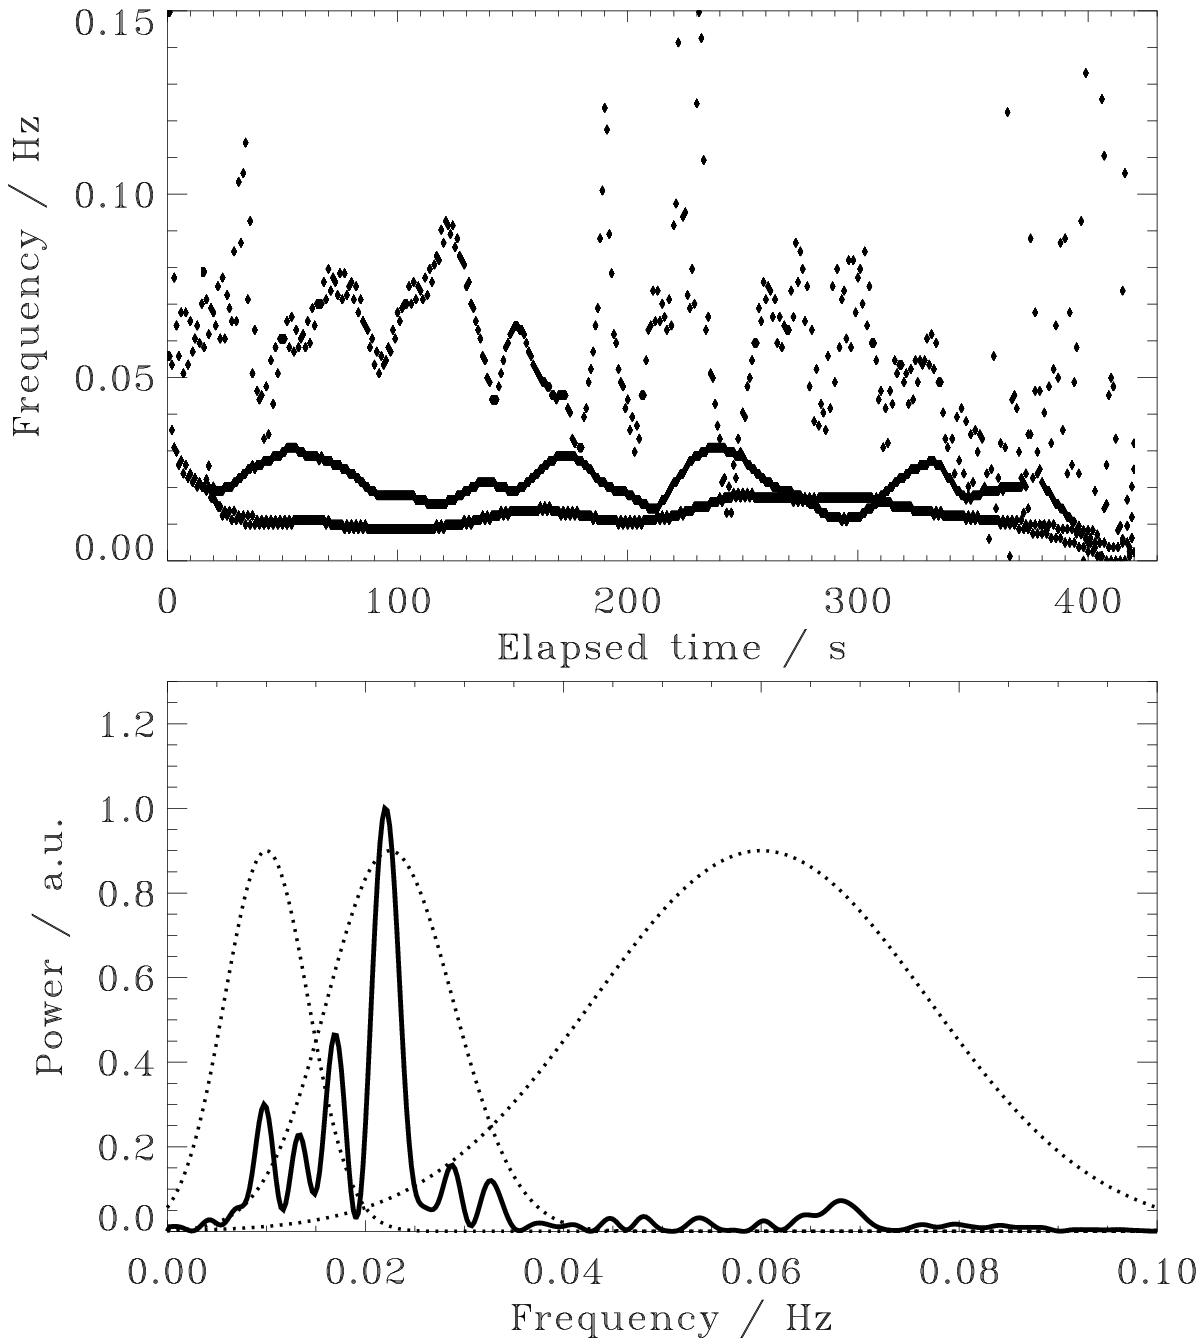
Upper panel: Hilbert spectrum (the instant frequency-time distribution) of empirically determined intrinsic modes 3, 4, 5. Darker pixels correspond to higher instant spectral power, bottom panel: Fourier power spectrum of the signal obtained as the sum of intrinsic modes 3, 4, 5. The Fourier power is normalised to the highest value. The elapsed time on the horizontal axis starts at 01:05:22 UT. The narrow-band Gaussian filters at 0.005–0.015 Hz, 0.015–0.03 Hz, 0.04–0.08 Hz are shown by the dotted curves.
Current usage metrics show cumulative count of Article Views (full-text article views including HTML views, PDF and ePub downloads, according to the available data) and Abstracts Views on Vision4Press platform.
Data correspond to usage on the plateform after 2015. The current usage metrics is available 48-96 hours after online publication and is updated daily on week days.
Initial download of the metrics may take a while.