Free Access
Fig. 3
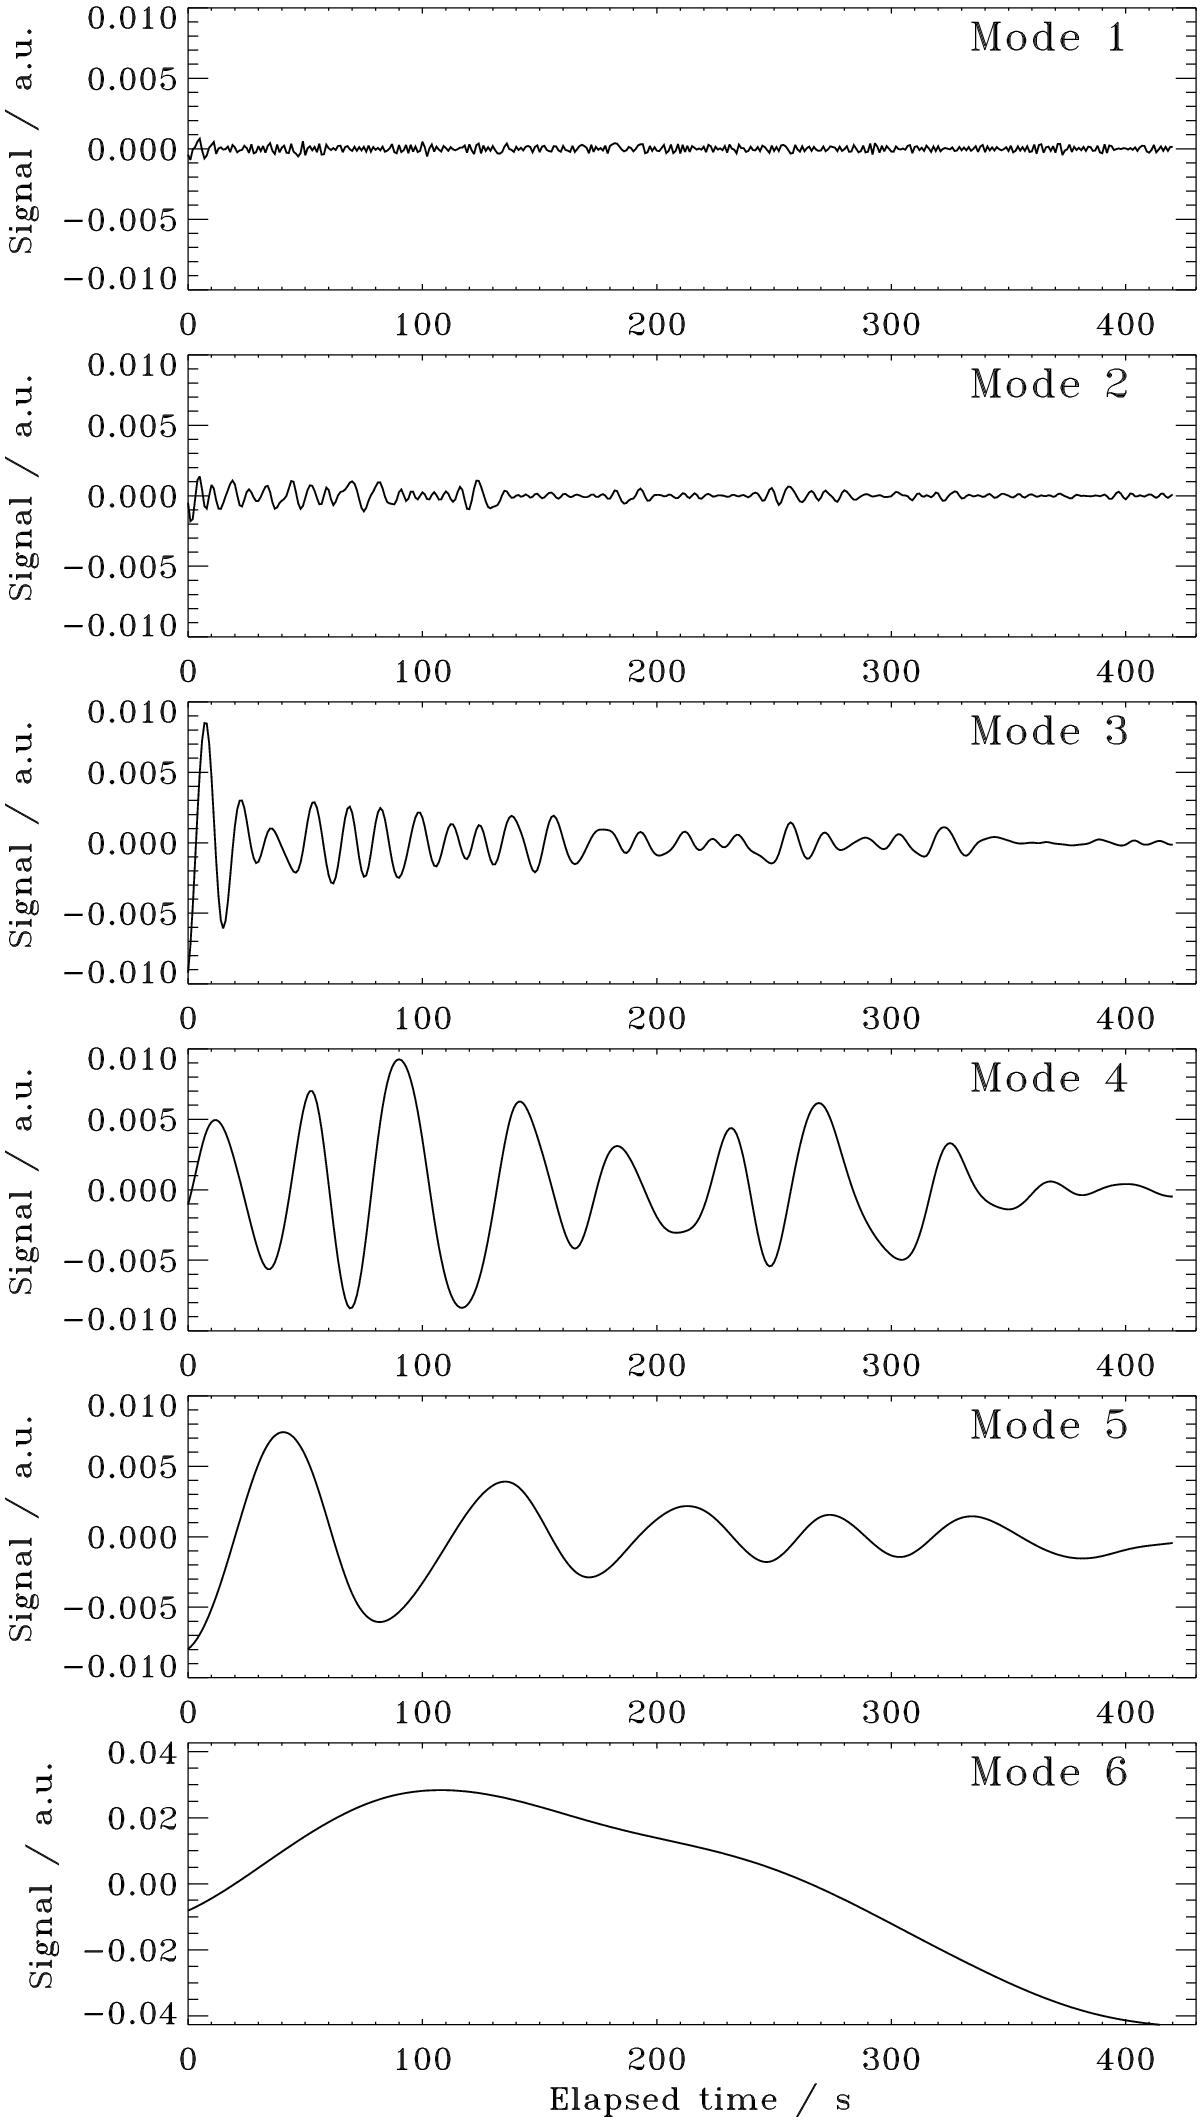
Intrinsic mode functions detected with the ensemble empirical mode decomposition (EEMD) technique in the NoRH correlation signal, presented in Fig. 2. All modes are normalised to the highest value of the correlation signal. The elapsed time on the horizontal axis starts at 01:05:22 UT.
Current usage metrics show cumulative count of Article Views (full-text article views including HTML views, PDF and ePub downloads, according to the available data) and Abstracts Views on Vision4Press platform.
Data correspond to usage on the plateform after 2015. The current usage metrics is available 48-96 hours after online publication and is updated daily on week days.
Initial download of the metrics may take a while.