Fig. 2
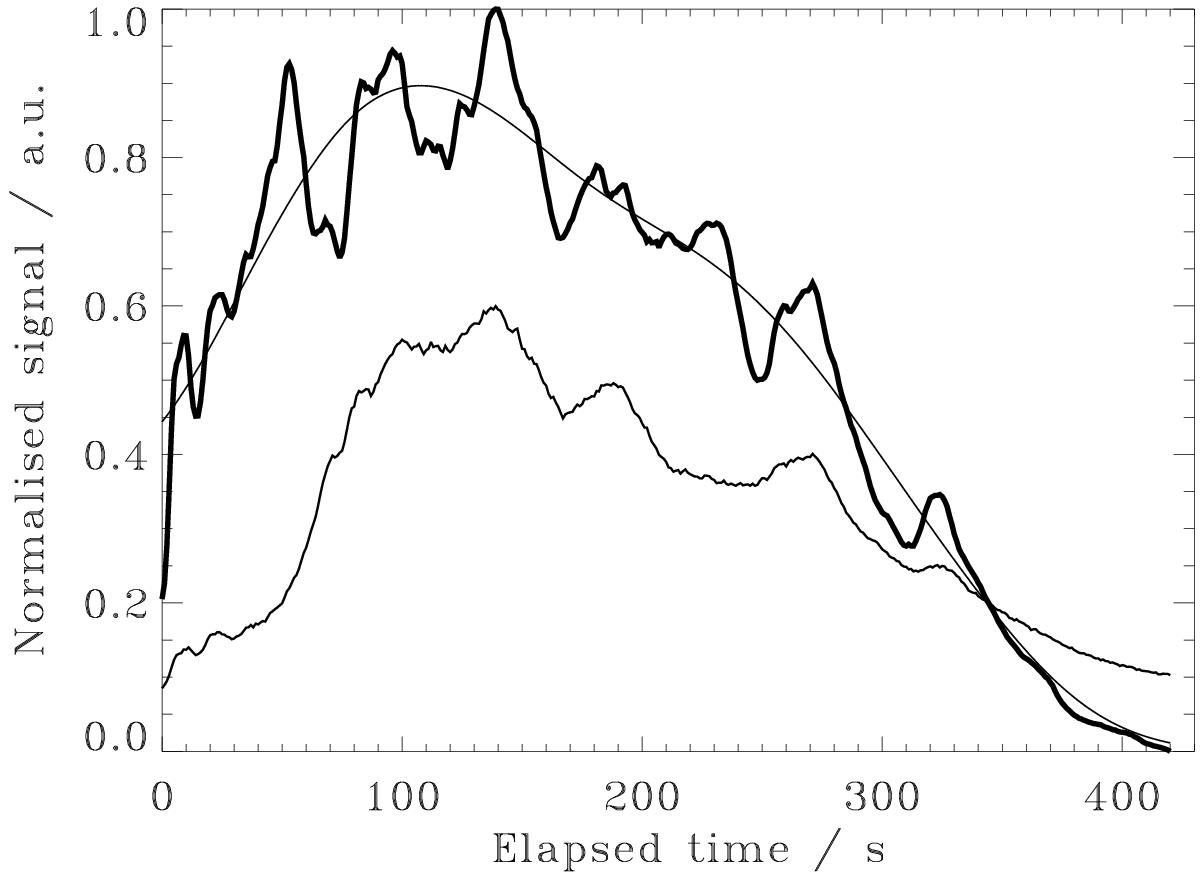
Upper thick line: correlation curve obtained with the Nobeyama Radioheliograph at 17 GHz. Upper thin line: the trend of the signal defined as the last EMD mode. Bottom thin line: integrated intensity R+L at 17 GHz, obtained with the Nobeyama Radiopolarimeter. The horizontal axis shows the time elapsed since 01:05:22 UT. Both the signals are normalised to their highest values. The integrated intensity signal is shifted downward for a better separation of the curves.
Current usage metrics show cumulative count of Article Views (full-text article views including HTML views, PDF and ePub downloads, according to the available data) and Abstracts Views on Vision4Press platform.
Data correspond to usage on the plateform after 2015. The current usage metrics is available 48-96 hours after online publication and is updated daily on week days.
Initial download of the metrics may take a while.