Fig. 6
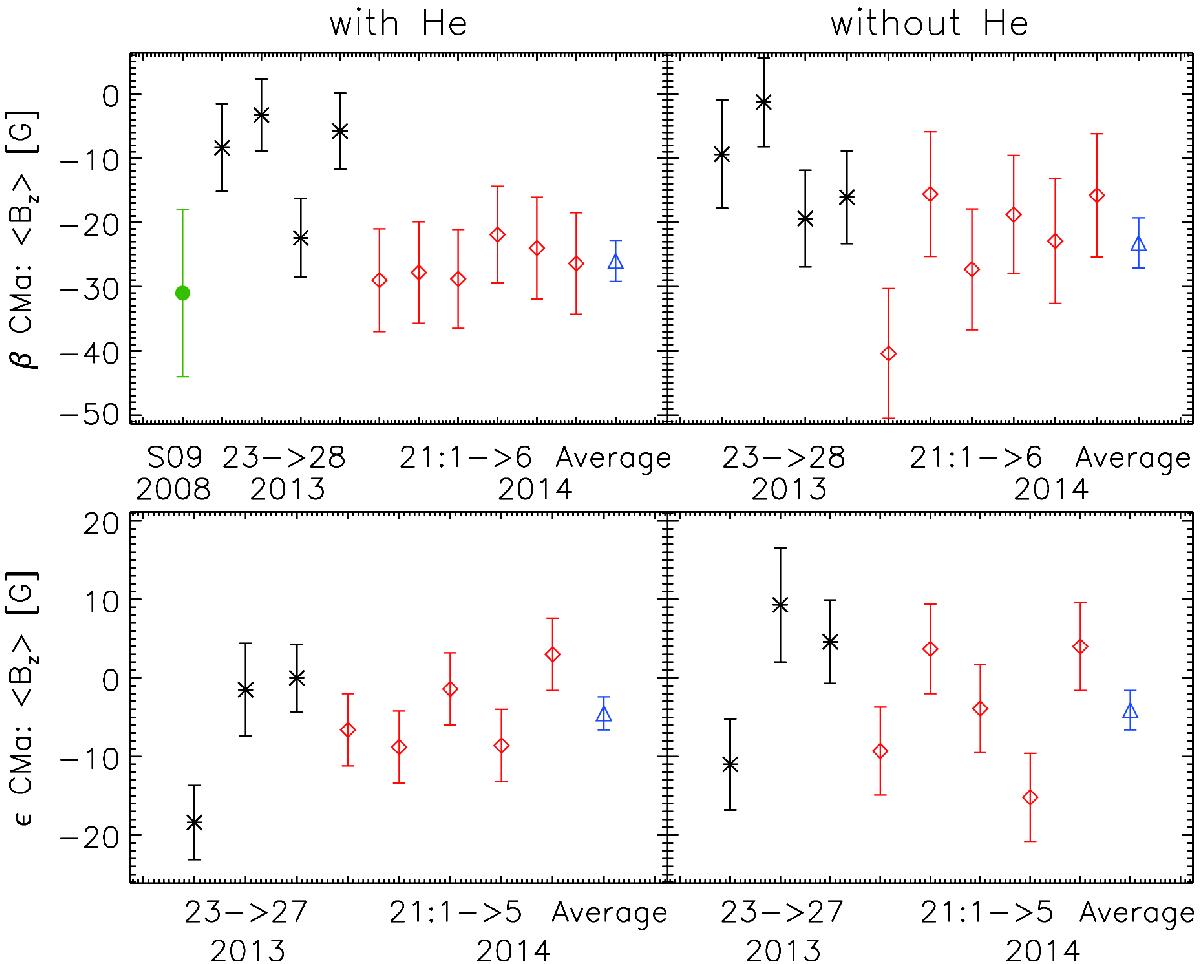
Time series of the ⟨ Bz ⟩ values obtained for β CMa (top panels) and ϵ CMa (bottom panels) using a line mask that includes (left panels) or excludes (right panels) helium lines. The black asterisks show the ⟨ Bz ⟩ values derived from the observations carried out in December 2013. The red rhombs show the ⟨ Bz ⟩ values obtained from each consecutive observation carried out in April 2014. The blue triangles indicate the ⟨ Bz ⟩ value extracted from the average LSD profiles obtained on 21 April 2014. The green dot on the left side of the top left panel shows the ⟨ Bz ⟩ value obtained by Silvester et al. (2009, S09) from the ESPaDOnS observation of β CMa carried out in 2008.
Current usage metrics show cumulative count of Article Views (full-text article views including HTML views, PDF and ePub downloads, according to the available data) and Abstracts Views on Vision4Press platform.
Data correspond to usage on the plateform after 2015. The current usage metrics is available 48-96 hours after online publication and is updated daily on week days.
Initial download of the metrics may take a while.