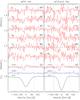
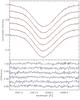
Fig. 4

Left plot: from bottom to top: weighted average Stokes I LSD profile (black solid line), weighted average LSD profile of the diagnostic N parameter (blue solid line), weighted average Stokes V LSD profile (red solid line), and six Stokes V LSD profiles obtained from the six single observations of β CMa obtained on 21 April 2014. The left panel shows the profiles obtained using a line mask containing He lines, while the right panel shows the profiles obtained with a line mask that does not contain He lines. The FAP-based field detection for Stokes V (see Sect. 3) is given in the top right corner of each Stokes V profile. The two bars at −40 km s-1 show the average uncertainty of the last single Stokes V profile and of the average Stokes V profile. The vertical dotted lines indicate the velocity range adopted for determining the detection probability and magnetic field value. All profiles have been rigidly shifted upwards/downwards by arbitrary values, and the Stokes V and N profiles have been expanded 250 times. Right plot: same as the plot on the right side of Fig. 3, but for the sequence of observations obtained on 21 April 2014, in sequential order from top to bottom.
Current usage metrics show cumulative count of Article Views (full-text article views including HTML views, PDF and ePub downloads, according to the available data) and Abstracts Views on Vision4Press platform.
Data correspond to usage on the plateform after 2015. The current usage metrics is available 48-96 hours after online publication and is updated daily on week days.
Initial download of the metrics may take a while.