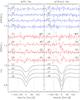
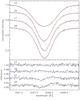
Fig. 3
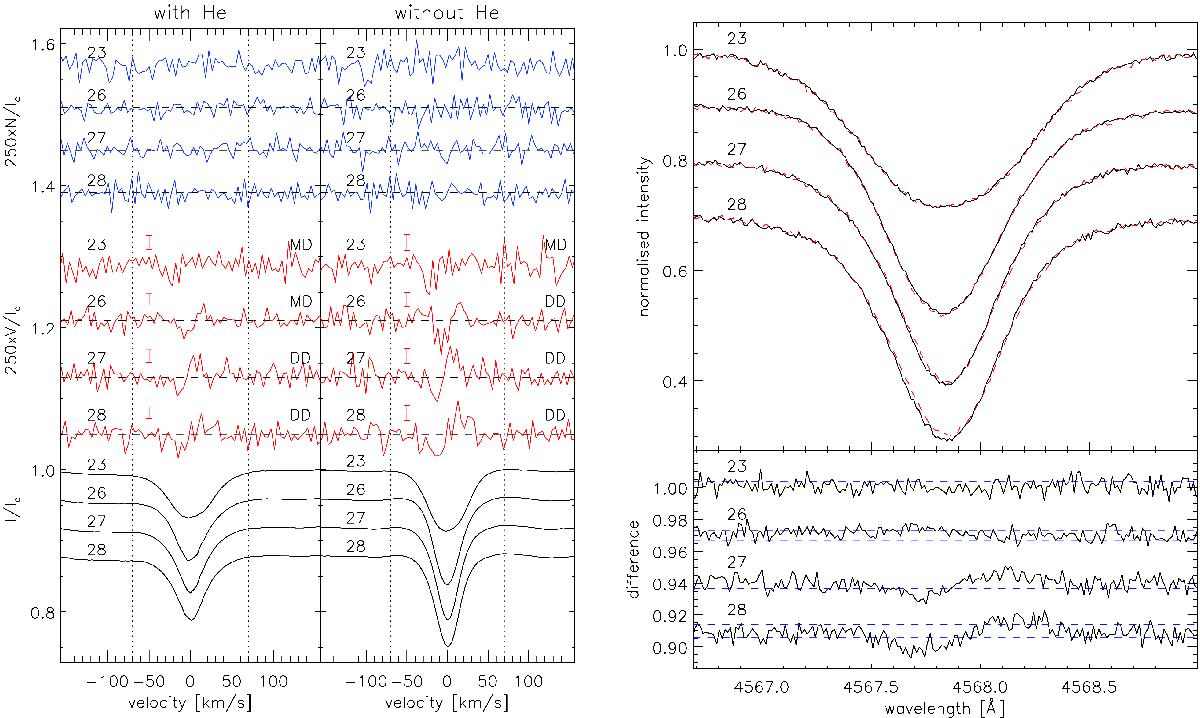
Left plot: LSD profiles of Stokes I (black solid line), V (red solid line), and N parameter (blue solid line) obtained for β CMa between 23 and 28 December 2013. The left panel shows the profiles obtained using a line mask containing He lines, while the right panel shows the profiles obtained with a line mask that does not contain He lines. The night of observation is given in the top left corner of each profile, and the FAP-based field detection is given in the top right corner of each Stokes V profile. The bar at −50 km s-1 shows the average uncertainty for each Stokes V profile. The vertical dotted lines indicate the velocity range adopted for determining the detection probability and magnetic field value. All profiles have been rigidly shifted upwards/downwards by arbitrary values and the Stokes V and N profiles have been expanded 250 times. Right plot – top panel: comparison between the profiles of the Si iii 4568 Å line recorded in the four nights of observation in the parallel beam with the retarder waveplate at +45° (black solid line) and +225° (red dashed line). One km s-1 corresponds to about 0.015 Å. Right plot – bottom panel: difference between the profiles shown in the top panel in each night of observation. For reference, the blue dashed lines indicate the standard deviation of each difference spectrum. In both panels, the number given in the top left corner of each profile indicates the night of observation in December 2013.
Current usage metrics show cumulative count of Article Views (full-text article views including HTML views, PDF and ePub downloads, according to the available data) and Abstracts Views on Vision4Press platform.
Data correspond to usage on the plateform after 2015. The current usage metrics is available 48-96 hours after online publication and is updated daily on week days.
Initial download of the metrics may take a while.