Fig. 13
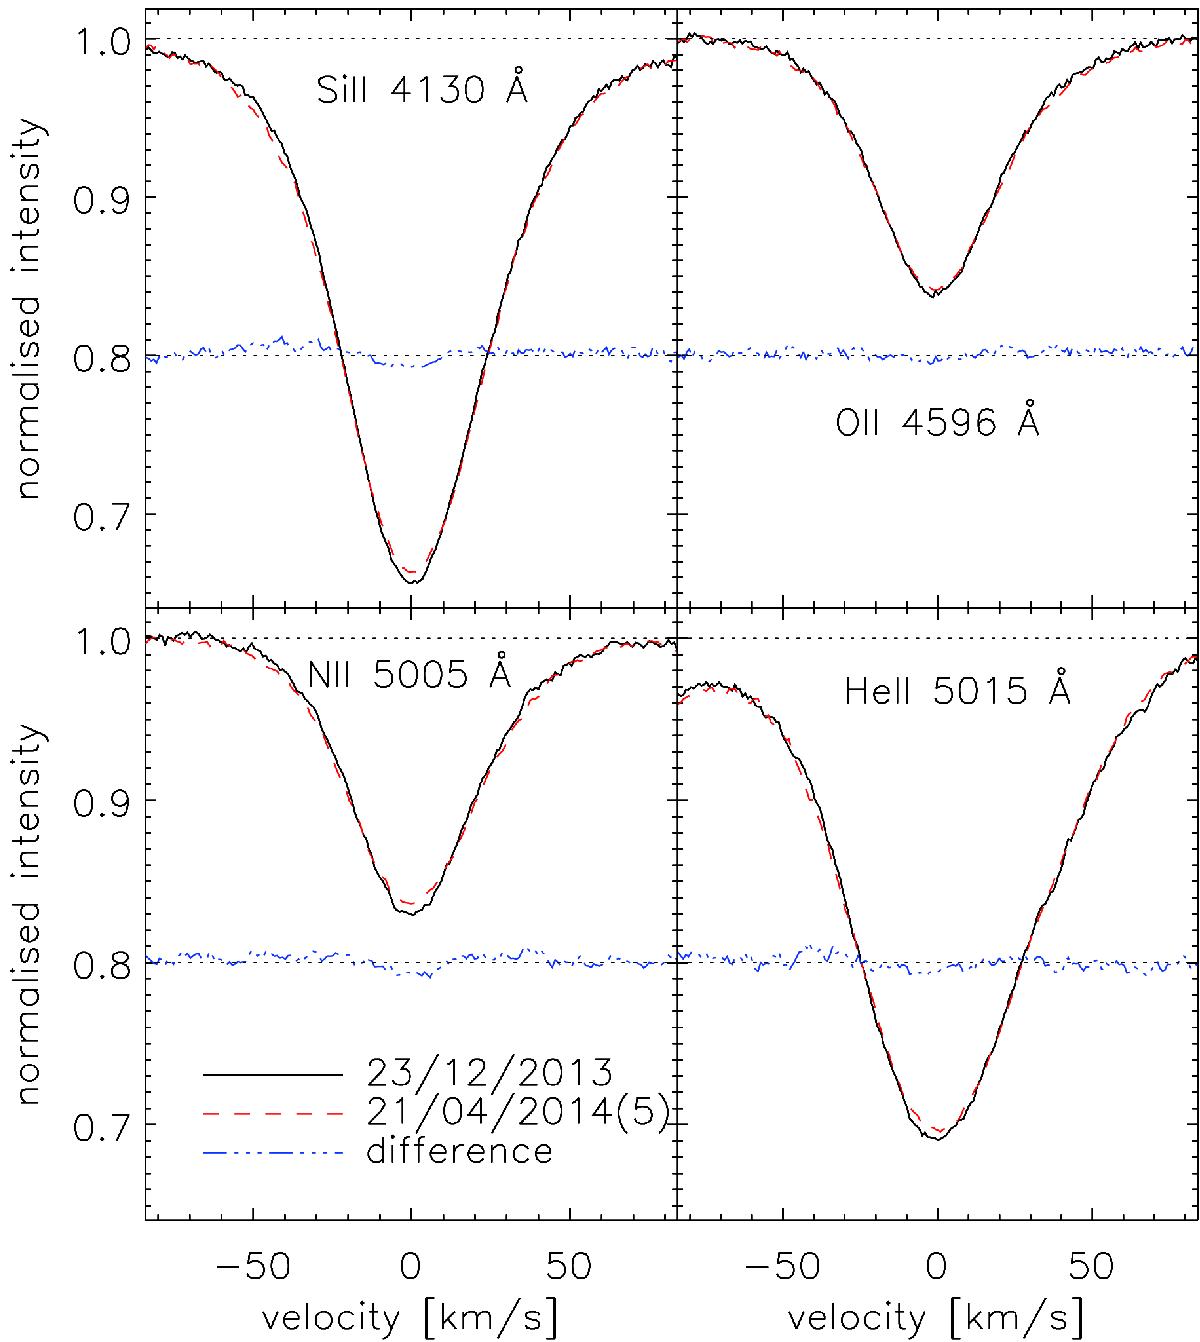
Comparison between the line profiles of ϵ CMa observed for the Si ii 4130 Å (top left), O ii 4596 Å (top right), N ii 5005 Å (bottom left), and He ii 5015 Å (bottom right) lines on the nights of 23 December 2013 and 21 April 2014, last exposure. Both profiles have been shifted using the radial velocity determined from the spectrum obtained on 23 December 2013. The blue dash-dotted line shows the difference between the two profiles, rigidly shifted upwards by 0.8.
Current usage metrics show cumulative count of Article Views (full-text article views including HTML views, PDF and ePub downloads, according to the available data) and Abstracts Views on Vision4Press platform.
Data correspond to usage on the plateform after 2015. The current usage metrics is available 48-96 hours after online publication and is updated daily on week days.
Initial download of the metrics may take a while.