Free Access
Fig. 1
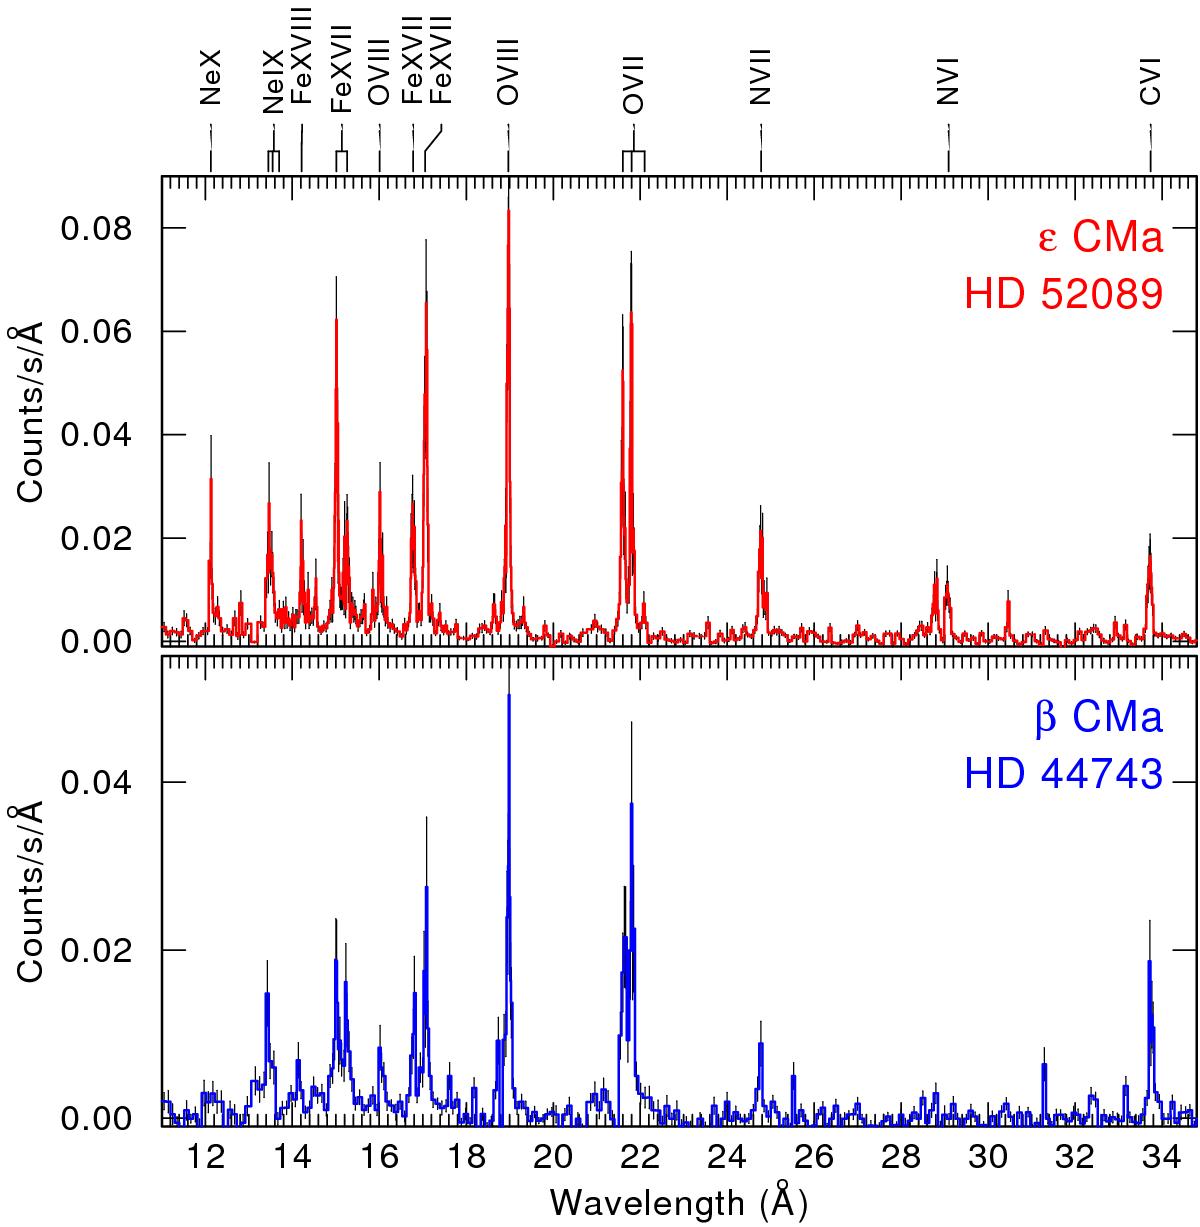
High-resolution X-ray spectra of ϵ CMa (top panel) and β CMa (bottom panel) obtained with the RGS spectrograph on board the XMM-Newton X-ray observatory. The error bars correspond to 3σ uncertainties. The major transitions are indicated at the top.
Current usage metrics show cumulative count of Article Views (full-text article views including HTML views, PDF and ePub downloads, according to the available data) and Abstracts Views on Vision4Press platform.
Data correspond to usage on the plateform after 2015. The current usage metrics is available 48-96 hours after online publication and is updated daily on week days.
Initial download of the metrics may take a while.