Fig. 9
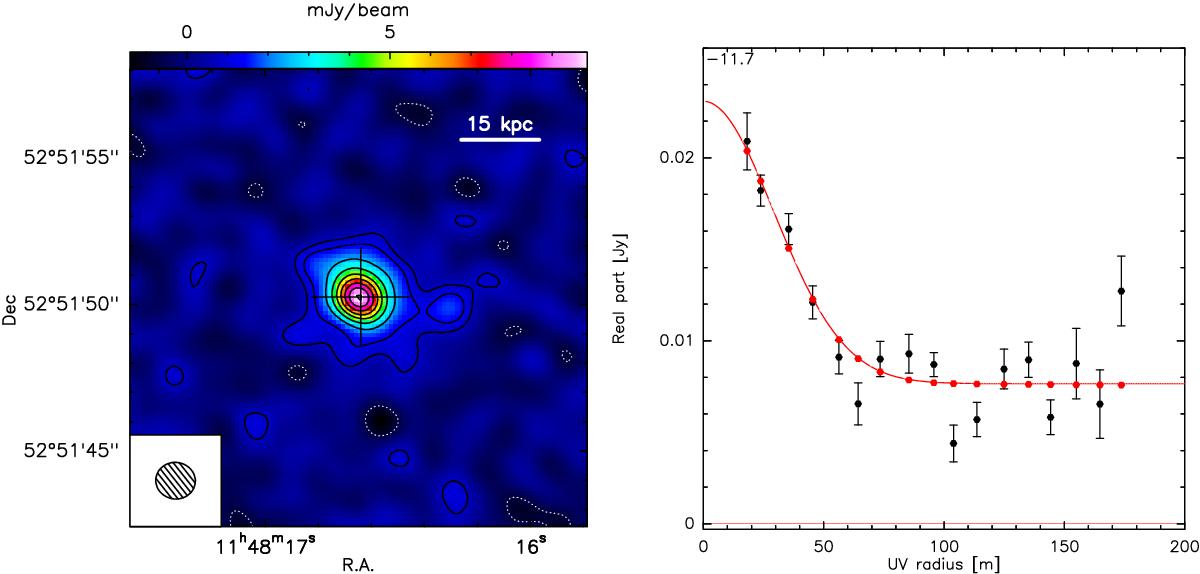
IRAM PdBI continuum-subtracted map (left) and uv plane analysis (right) of the core of the [C ii] 158 μm emission line of SDSS J1148+5251, integrated within v ∈ ( − 200,200) km s-1. Left: negative and positive contours correspond to − 3σ, 3σ, 5σ to 40σ in steps of 5σ (1σ rms noise is 0.10 Jy beam-1 km s-1). The cross indicates the pointing and phase centre, corresponding to the optical position of the quasar. Right: real part of visibilities as a function of the uv distance (uv plot), binned in baseline steps of 10 m. The red curve indicates the best fit to the uv plot, which corresponds to the sum of two components: a point (unresolved) source, responsible for the flattening of the visibilities at large uv radii (uv radii > 50 m), and an extended (resolved) source fitted with a circular Gaussian model, which is responsible for the sharp decline of the visibilities at small uv radii.
Current usage metrics show cumulative count of Article Views (full-text article views including HTML views, PDF and ePub downloads, according to the available data) and Abstracts Views on Vision4Press platform.
Data correspond to usage on the plateform after 2015. The current usage metrics is available 48-96 hours after online publication and is updated daily on week days.
Initial download of the metrics may take a while.