Fig. 8
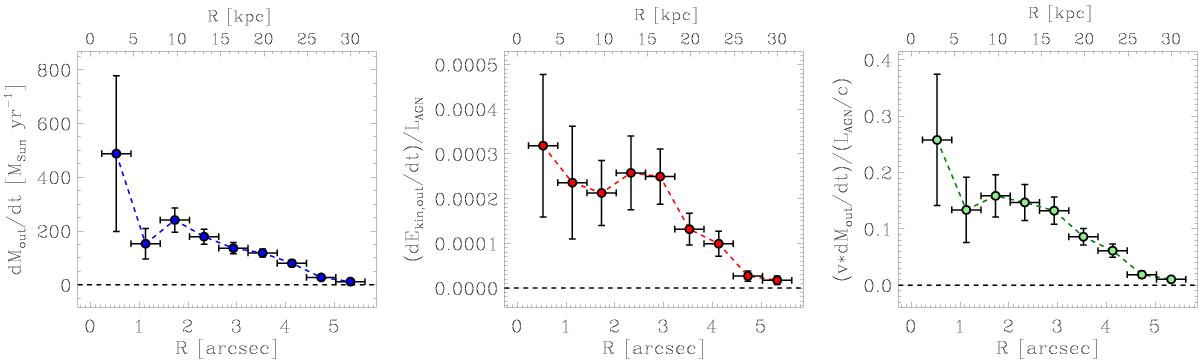
Outflow mass-loss rate Ṁout (left), kinetic power ratio ![]() (centre) and momentum rate ratio (Ṁoutv) / (LAGN/c) (right) as a function of the projected distance from the quasar position. These plots have been obtained by dividing the outflowing clumps (see Sect. 3.4) in bins of ΔR = 0.6 arcsec, corresponding to ≃3 kpc. The plots show, in correspondence of the average R of each bin, the total Ṁout,
(centre) and momentum rate ratio (Ṁoutv) / (LAGN/c) (right) as a function of the projected distance from the quasar position. These plots have been obtained by dividing the outflowing clumps (see Sect. 3.4) in bins of ΔR = 0.6 arcsec, corresponding to ≃3 kpc. The plots show, in correspondence of the average R of each bin, the total Ṁout, ![]() and (Ṁoutv) / (LAGN/c) obtained by adding up the contribution of all the outflowing clumps within the bin. For an explanation of the error bars, see caption of Fig. 7.
and (Ṁoutv) / (LAGN/c) obtained by adding up the contribution of all the outflowing clumps within the bin. For an explanation of the error bars, see caption of Fig. 7.
Current usage metrics show cumulative count of Article Views (full-text article views including HTML views, PDF and ePub downloads, according to the available data) and Abstracts Views on Vision4Press platform.
Data correspond to usage on the plateform after 2015. The current usage metrics is available 48-96 hours after online publication and is updated daily on week days.
Initial download of the metrics may take a while.