Fig. 7
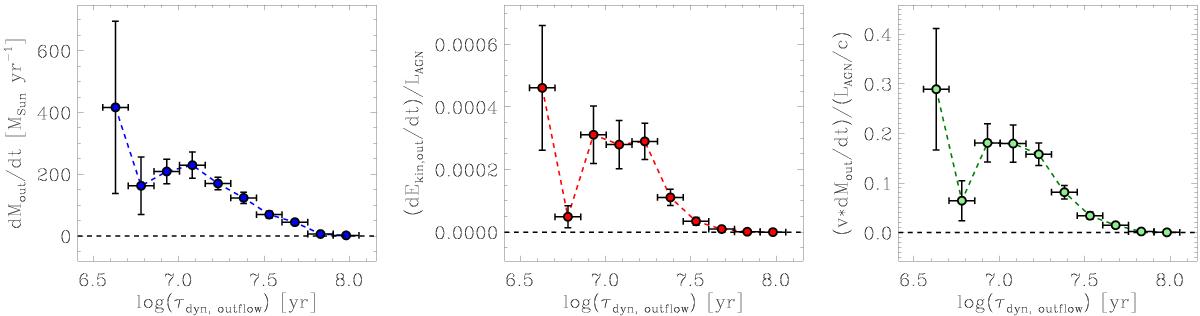
Outflow mass-loss rate Ṁout (left), kinetic power ratio ![]() (centre) and momentum rate ratio (Ṁoutv) / (LAGN/c) (right) as a function of the dynamical time scale of the clumps in outflow. These plots have been obtained by dividing the outflowing clumps (see Sect. 3.4) in bins of Δlog (τdyn) = 0.15. The plots show, in correspondence of the average τdyn of each bin, the total Ṁout,
(centre) and momentum rate ratio (Ṁoutv) / (LAGN/c) (right) as a function of the dynamical time scale of the clumps in outflow. These plots have been obtained by dividing the outflowing clumps (see Sect. 3.4) in bins of Δlog (τdyn) = 0.15. The plots show, in correspondence of the average τdyn of each bin, the total Ṁout, ![]() and (Ṁoutv) / (LAGN/c) obtained by adding up the contribution of all the outflowing clumps within the bin. The error bars in the x direction indicate the bin size, i.e. Δx = ± 0.075. The error bars in the y direction are calculated using the statistical error propagation (i.e. by propagating the errors on v, R and on the [C ii] fluxes measured for each clump in outflow, which are estimated in Appendix C). The errors do not take into account the uncertainty on the conversion from [C ii] luminosity to atomic gas mass and the uncertainty on the AGN luminosity estimate (Schneider et al. 2014).
and (Ṁoutv) / (LAGN/c) obtained by adding up the contribution of all the outflowing clumps within the bin. The error bars in the x direction indicate the bin size, i.e. Δx = ± 0.075. The error bars in the y direction are calculated using the statistical error propagation (i.e. by propagating the errors on v, R and on the [C ii] fluxes measured for each clump in outflow, which are estimated in Appendix C). The errors do not take into account the uncertainty on the conversion from [C ii] luminosity to atomic gas mass and the uncertainty on the AGN luminosity estimate (Schneider et al. 2014).
Current usage metrics show cumulative count of Article Views (full-text article views including HTML views, PDF and ePub downloads, according to the available data) and Abstracts Views on Vision4Press platform.
Data correspond to usage on the plateform after 2015. The current usage metrics is available 48-96 hours after online publication and is updated daily on week days.
Initial download of the metrics may take a while.