Fig. 5
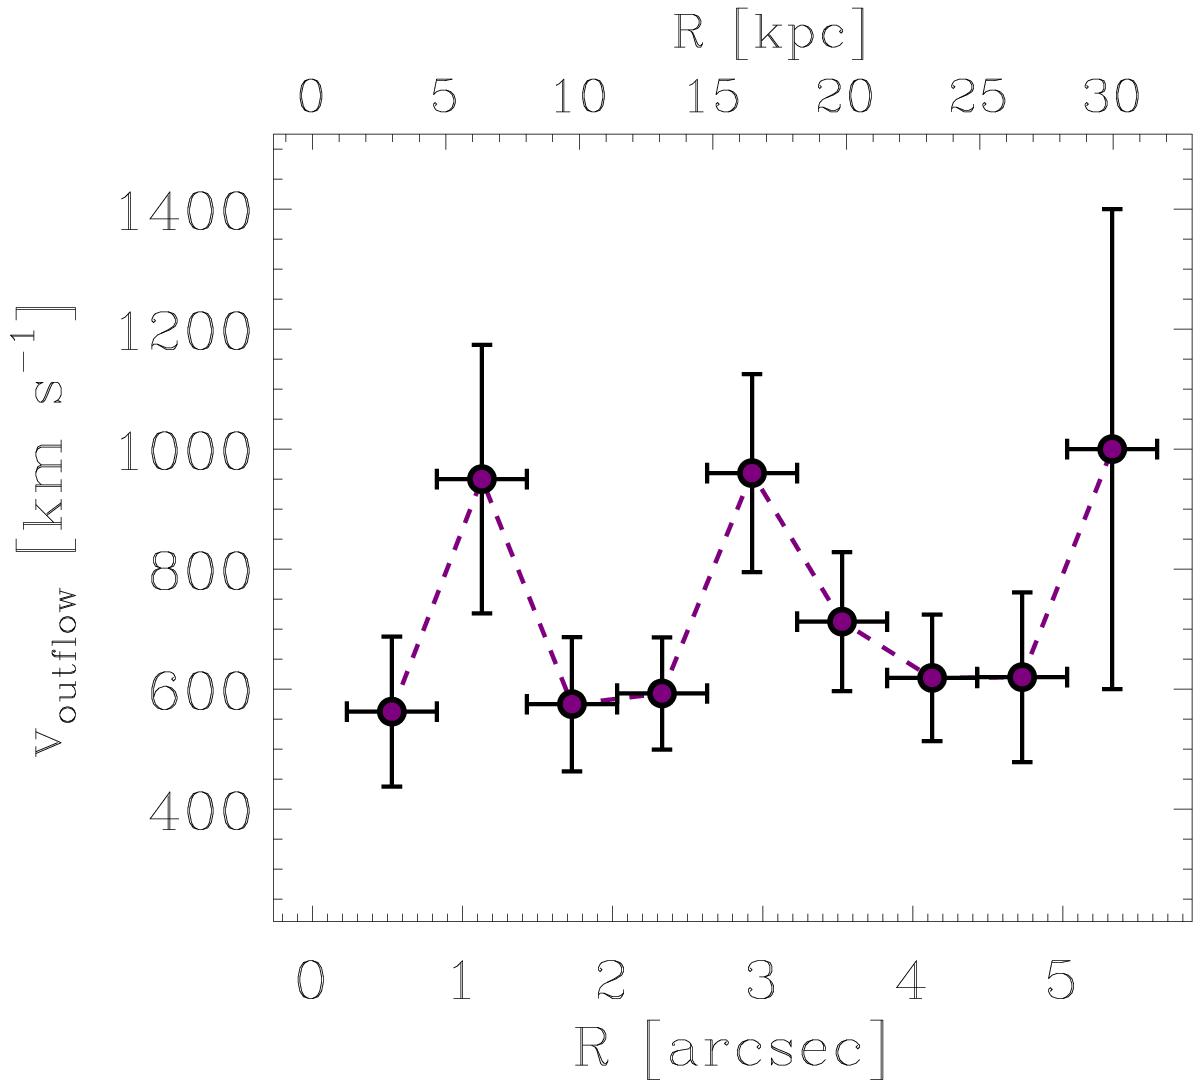
Outflow velocity as a function of the radial distance from the quasar position. Both R and v are projected quantities. To produce this plot, the outflowing clumps have been divided into bins of radial distance from the quasar (ΔR = 0.6 arcsec, i.e. ≃3 kpc). The plot shows the average velocity of the clumps within each bin (![]() , where N is the number of clumps in each bin). The error bars in the x direction indicate the bin size. The error on ⟨ v ⟩ is given by
, where N is the number of clumps in each bin). The error bars in the x direction indicate the bin size. The error on ⟨ v ⟩ is given by ![]() , where σvi is the uncertainty on the average velocity vi of a clump in outflow, estimated as explained in Appendix C.
, where σvi is the uncertainty on the average velocity vi of a clump in outflow, estimated as explained in Appendix C.
Current usage metrics show cumulative count of Article Views (full-text article views including HTML views, PDF and ePub downloads, according to the available data) and Abstracts Views on Vision4Press platform.
Data correspond to usage on the plateform after 2015. The current usage metrics is available 48-96 hours after online publication and is updated daily on week days.
Initial download of the metrics may take a while.