Fig. 4
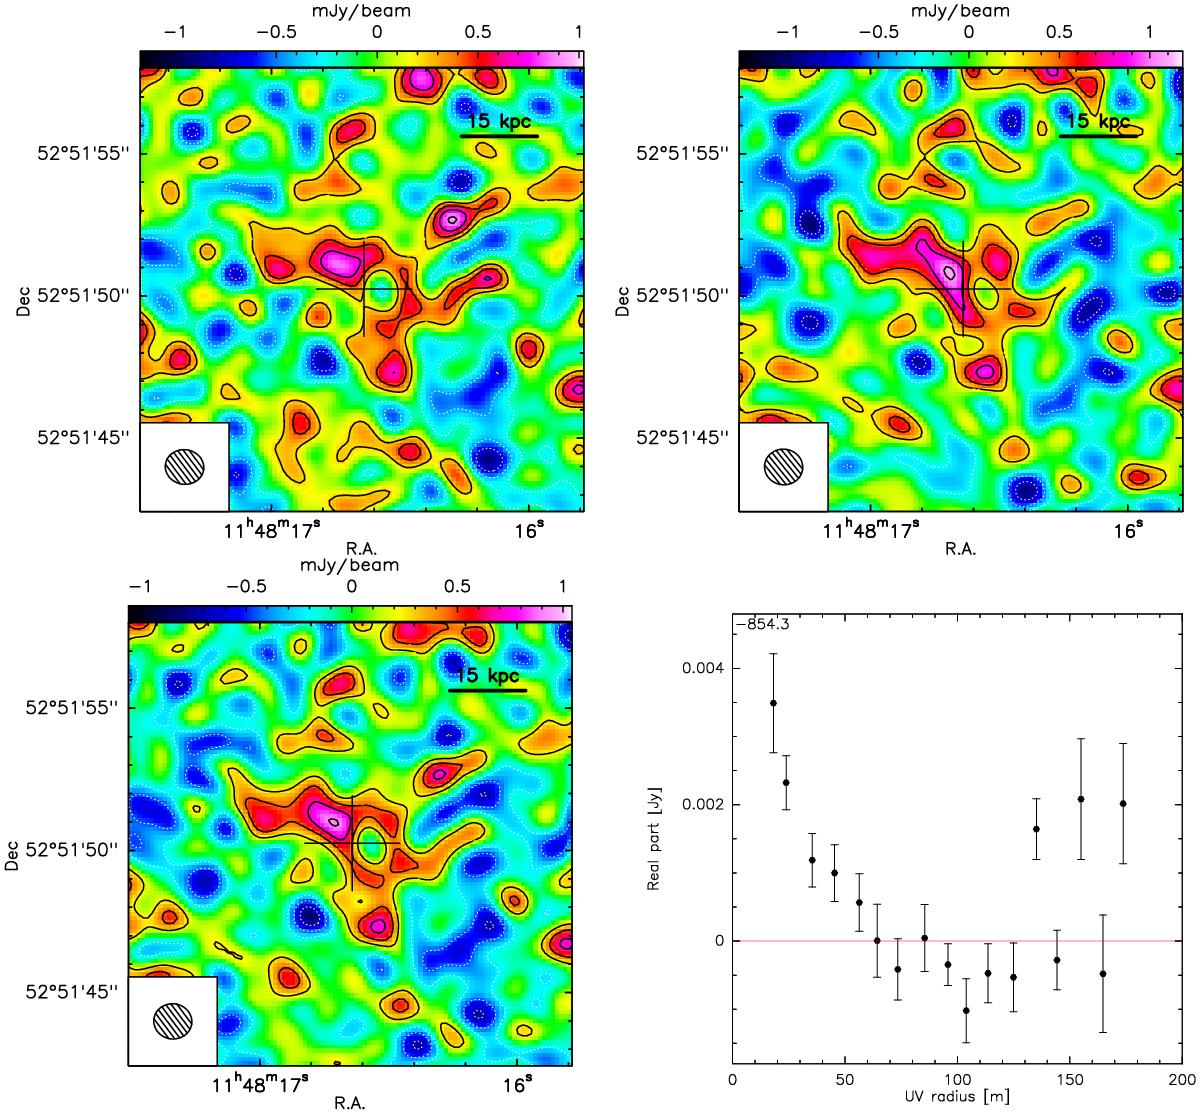
Top panels: IRAM PdBI continuum-subtracted maps of the blue (left) and red (right) wings of the [C ii] 158 μm line of SDSS J1148+5251, integrated within v ∈ ( − 1400, − 300) km s-1and v ∈ (400,1200) km s-1, respectively. Negative and positive contours are in steps of 1.5σ (1σ rms is 0.17 Jy beam-1 km s-1 and 0.14 Jy beam-1 km s-1 for the blue and red wing, respectively). Bottom panels: map of the blue and red wings merged together (left) and corresponding uv plot (right). In the map of the merged wings, negative and positive contours are in steps of 2σ (1σ rms is 0.21 Jy beam-1 km s-1). The uv plot shows the real part of visibilities as a function of the uv distance, binned in baseline steps of 10 m. In all maps, the cross indicates the pointing and phase centre, corresponding to the optical position of the quasar.
Current usage metrics show cumulative count of Article Views (full-text article views including HTML views, PDF and ePub downloads, according to the available data) and Abstracts Views on Vision4Press platform.
Data correspond to usage on the plateform after 2015. The current usage metrics is available 48-96 hours after online publication and is updated daily on week days.
Initial download of the metrics may take a while.