Fig. 3
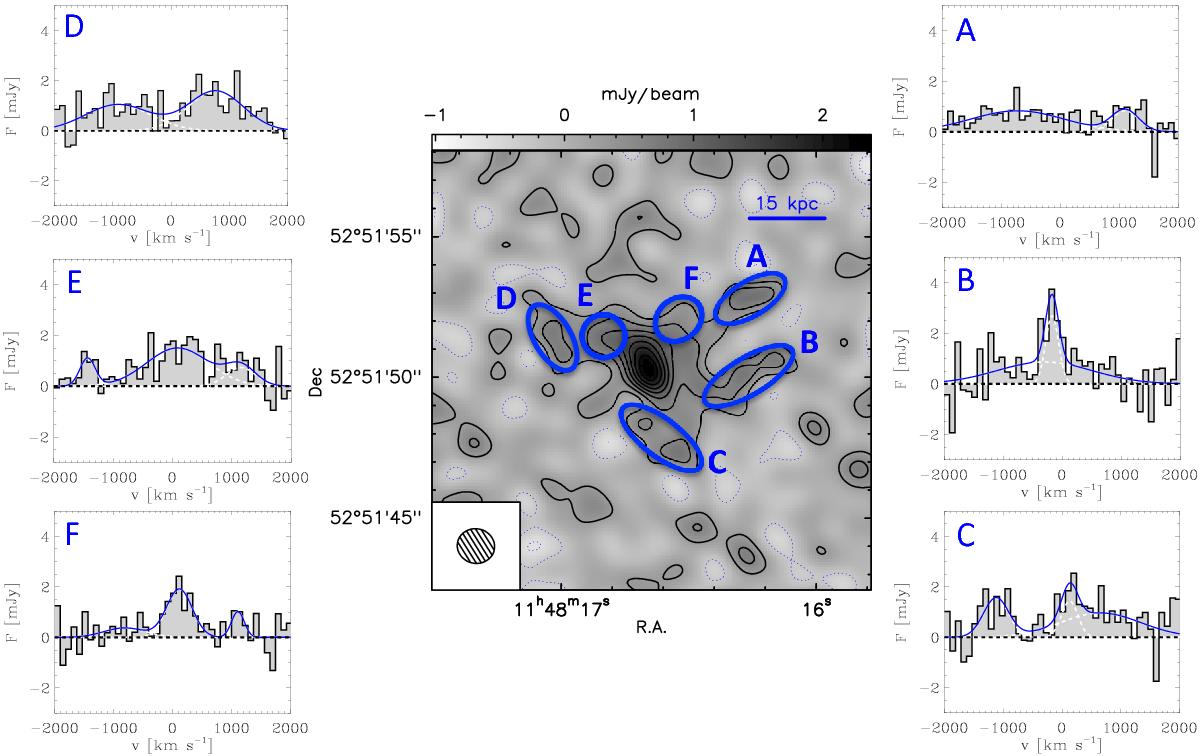
IRAM PdBI continuum-subtracted map of the total [C ii] 158 μm emission of SDSS J1148+5251, integrated within v ∈ ( − 1400,1200) km s-1, along with spectra extracted from different positions on the source. Negative and positive contours are in steps of 3σ (1σ rms noise is 0.26 Jy beam-1 km s-1). For display purposes, the spectra have been re-binned by a factor of 4, corresponding to channels of 93.6 km s-1. The Gaussian fits to the line profiles are performed on the original non-binned spectra and the fits results are presented in Table B.1.
Current usage metrics show cumulative count of Article Views (full-text article views including HTML views, PDF and ePub downloads, according to the available data) and Abstracts Views on Vision4Press platform.
Data correspond to usage on the plateform after 2015. The current usage metrics is available 48-96 hours after online publication and is updated daily on week days.
Initial download of the metrics may take a while.